Hollow Point Trading
Hollow Point Trading Discord server banner

Hollow Point Trading Updates & Events

Server Updates & Events

Announcements

Spot the Real Bullish Engulfing Pattern

https://youtu.be/XSct0Pxr9A0

Which Is the Real Bullish engulfing? Choose Before the Reveal #Shorts


Can you spot the bullish engulfing before the answer appears? Look for a green real body that encloses the preceding red real body. Compare both examples carefully. One misses a defining feature. The correct shape is the starting point, not a prediction. Check the preceding trend and the next price response before drawing a conclusion.

Original...

Spot the Real Bullish Engulfing Pattern

Spot the Real Bearish Engulfing Pattern

https://youtu.be/qcwZfYhis_k

Which Is the Real Bearish engulfing? Choose Before the Reveal #Shorts


Can you spot the bearish engulfing before the answer appears? Look for a red real body that encloses the preceding green real body. Compare both examples carefully. One misses a defining feature. The correct shape is the starting point, not a prediction. Check the preceding trend and the next price response before drawing a conclusion.

Original...

Spot the Real Bearish Engulfing Pattern

Inverted Hammer Confirmation: Watch the Next Candle

https://youtu.be/k61qZmkbKds

Is This Inverted hammer Confirmed Yet? Watch the Next Candle #Shorts


Is this inverted hammer ready to interpret, or is the important bar still forming? Its structure is a small body near the low with a long upper wick. Watch the next completed close and the response at the relevant boundary. Follow-through adds evidence, but it cannot guarantee continuation. An unfinished candle can change before the interval end...

Inverted Hammer Confirmation: Watch the Next Candle

Spot the Real Inverted Hammer Candlestick

https://youtu.be/URgnqGetKxw

Which Is the Real Inverted hammer? Choose Before the Reveal #Shorts


Can you spot the inverted hammer before the answer appears? Look for a small body near the low with a long upper wick. Compare both examples carefully. One misses a defining feature. The correct shape is the starting point, not a prediction. Check the preceding trend and the next price response before drawing a conclusion.

Original Hollow Point...

Spot the Real Inverted Hammer Candlestick

Hanging Man Candlestick: Why Trend Context Matters

https://youtu.be/GHdXBo5G230

Hanging man: Same Shape, Different Trend—What Changes? #Shorts


These charts show the same hanging man geometry. Do they tell the same story? The usual context is after an advance. Now compare that with the second chart. The shape can remain identical while its relevance changes. Read the trend and location first. A familiar name alone does not establish a directional edge.

Original Hollow Point Trading ani...

Hanging Man Candlestick: Why Trend Context Matters

Spot the Real Hanging Man Candlestick Pattern

https://youtu.be/POM5MeNZ-ns

Which Is the Real Hanging man? Choose Before the Reveal #Shorts


Can you spot the hanging man before the answer appears? Look for a small body near the high with a long lower wick. Compare both examples carefully. One misses a defining feature. The correct shape is the starting point, not a prediction. Check the preceding trend and the next price response before drawing a conclusion.

Original Hollow Point Tr...

Spot the Real Hanging Man Candlestick Pattern

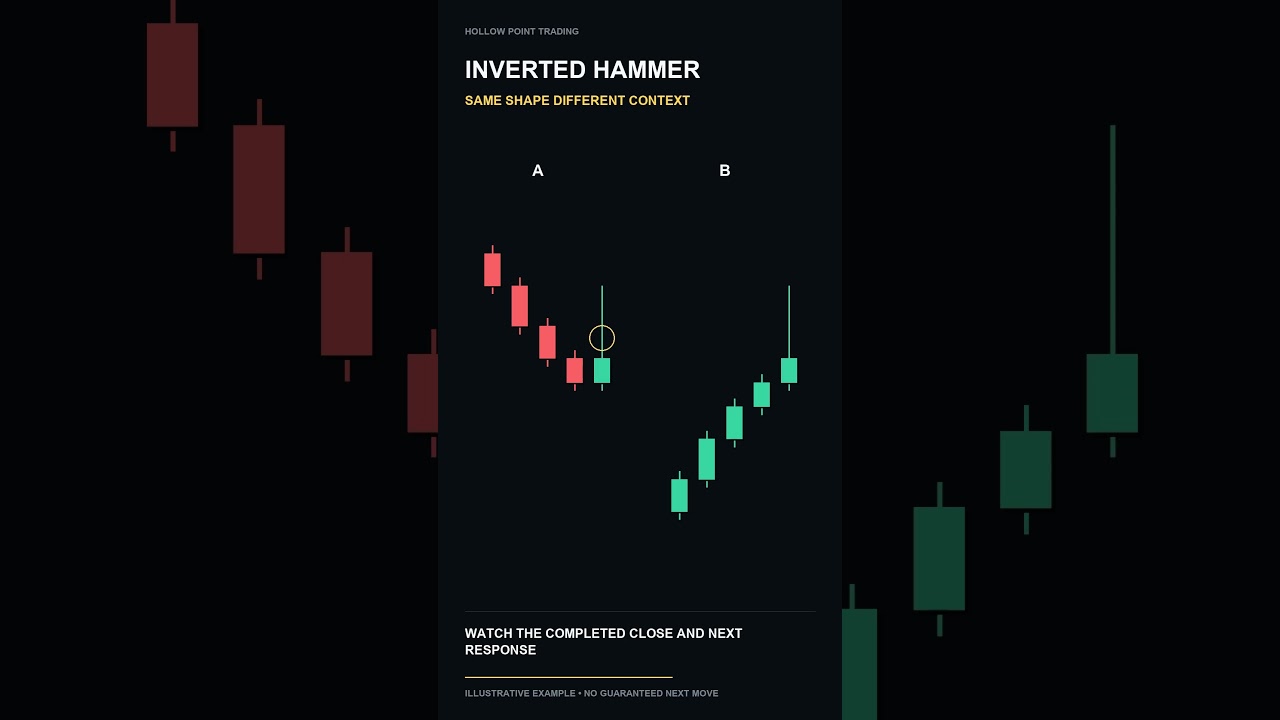
Inverted Hammer Candlestick: Why Trend Context Matters

https://youtu.be/yXBdR_vrtu4

Inverted hammer: Same Shape, Different Trend—What Changes? #Shorts


These charts show the same inverted hammer geometry. Do they tell the same story? The usual context is after a decline. Now compare that with the second chart. The shape can remain identical while its relevance changes. Read the trend and location first. A familiar name alone does not establish a directional edge.

Original Hollow Point Trading ...

Inverted Hammer Candlestick: Why Trend Context Matters

Stock Market Update: Software Leads, Chips Lag

https://youtu.be/JN8TAqnQqUs

Stock Market Update: The Bounce Is Hiding a Split—Who Leads Next?


Friday's bounce had a different engine. Software gained while semiconductors lagged. Is leadership broadening, or is the index masking a split?

October 9, 2026 Saturday deep dive: QQQ, SPY and SPX; RSP and breadth; NDFI and S5FI; software versus chips; the sector scan; a stock watchlist; Micron; Treasury yields, the dollar, commodities, inflati...

Stock Market Update: Software Leads, Chips Lag

SNDK Low Reclaim: Keep the Reference Fixed

https://youtu.be/vzkPqPHHOoI

SNDK: A low reclaim needs a fixed reference #Shorts


The prior candle low is 1668.69. The next candle reaches 1668.02, an overshoot of 0.67, and closes back above the reference at 1669.31. Now leave that original low in place as the next candles arrive. Moving the reference to each new candle changes the test you are running. A completed close back above the original level is a reclaim observation...

SNDK Low Reclaim: Keep the Reference Fixed

AAPL Range Expansion: Why Candle Bodies Matter

https://youtu.be/m_TkqCsTc1c

AAPL: Range expansion is not body expansion #Shorts


This candle has a full range of 0.88. The preceding range is 0.48, so the new range is approximately 1.8 times as large. That comparison includes both wicks. It does not tell you how much of the candle is body or whether the next move continues. Compare the open and close separately, then watch the following response. A wider range means more pr...

AAPL Range Expansion: Why Candle Bodies Matter

SNDK Candlestick Analysis: Range vs. Body

https://youtu.be/hKScqUdN-9w

SNDK: A wide candle can have a small body #Shorts


This candle has a full range of 5.06. The preceding range is 2.63, so the new range is approximately 1.9 times as large. Now compare the candle body with that full range. Long wicks can create a wide high to low distance even when the open and close are close together. Calling every wide candle a strong directional candle mixes two measurements....

SNDK Candlestick Analysis: Range vs. Body

TSLA Inside Bar: Check Both Boundaries

https://youtu.be/FUgbxDm26oo

TSLA: Inside bar: check both boundaries #Shorts


Do not check only one side of an inside bar. The mother candle high is 380.93 and its low is 380.46. The next candle high stays 0.01 below that high, while its low stays 0.04 above the mother low. Both boundaries are contained. That establishes range contraction. It does not choose the breakout direction. Keep the mother range fixed and wait for...

TSLA Inside Bar: Check Both Boundaries

AAPL Inside Bar Trading: Why Candle Color Doesn't Matter

https://youtu.be/pVbD-RCSbNk

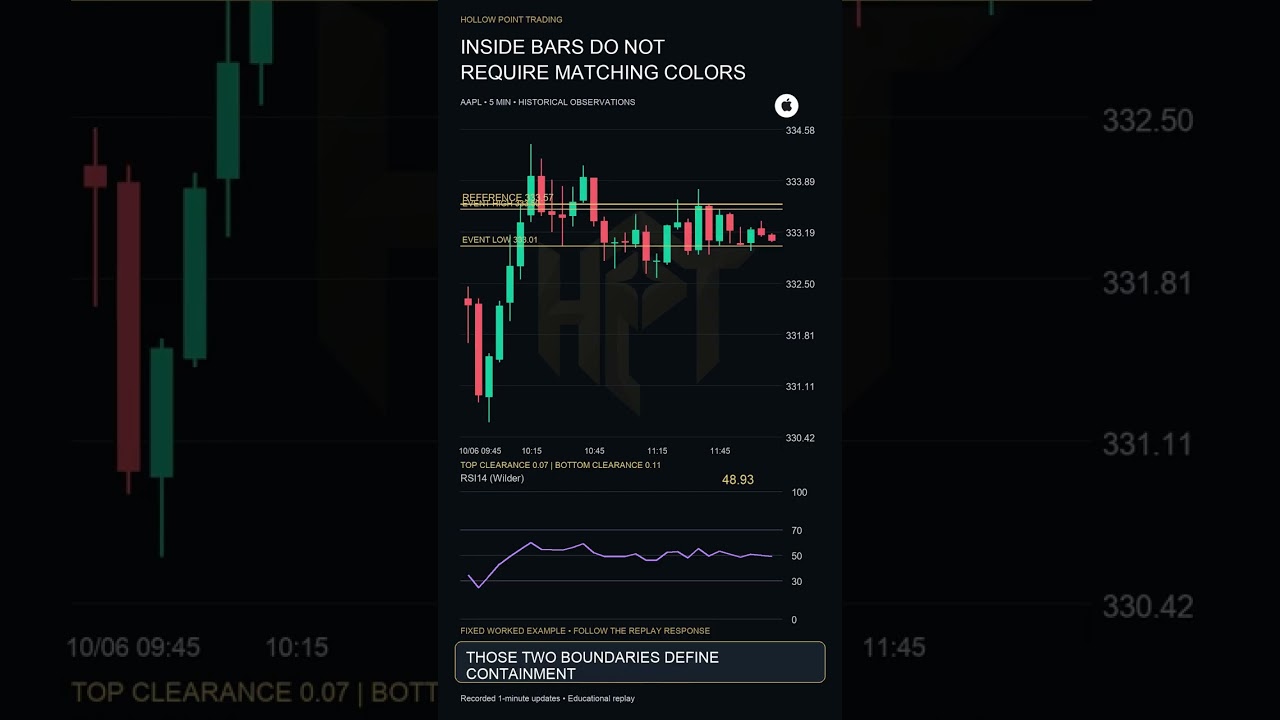
AAPL: Inside bars do not require matching colors #Shorts


Do not check only one side of an inside bar. The mother candle high is 333.57 and its low is 332.89. The next candle high stays 0.07 below that high, while its low stays 0.11 above the mother low. Those two boundaries define containment. Candle color is a separate observation: an inside bar does not need the same color as its mother candle. Chec...

AAPL Inside Bar Trading: Why Candle Color Doesn't Matter

SNDK Red Candle, Higher Close: How to Read It

https://youtu.be/WOf9zJuq4o0

SNDK: A red candle can close higher #Shorts


This Sandisk candle is red because it closes below its own open. Its open is 1669.70, and its close is 1669.31. But the preceding candle closed at 1669.11. The red candle still closes higher than that previous close. Candle color compares the open and close within one candle. Close to close change compares two candles. Read the reference before ...

SNDK Red Candle, Higher Close: How to Read It

TSLA Bearish Engulfing: How to Read the Pattern

https://youtu.be/zTeMUxR2A4o

TSLA: Bearish engulfing bodies #Shorts


Compare these real bodies. The earlier green candle opens at 376.91 and closes at 376.99. The next red body covers that interval, opening at 377.05 and closing at 376.73. That is bearish engulfing body geometry. It does not require engulfing the wicks. Read the location and next response before assuming continuation.

HPT educational replay usin...

TSLA Bearish Engulfing: How to Read the Pattern

AAPL Long Upper Wick: What the Candle Reveals

https://youtu.be/YLAJtS219O8

AAPL: Long upper wick #Shorts


This upper wick measures 0.26, out of a full range of 0.34. Price traded above the real body, then finished below the high. A long wick describes the completed candle. It cannot identify individual orders or guarantee the next direction. Compare the high with nearby resistance and watch whether a later close reclaims it.

HPT educational replay ...

AAPL Long Upper Wick: What the Candle Reveals

TSLA Equal Highs: Using a Two-Cent Tolerance

https://youtu.be/-8Rs1jUxhCU

TSLA: Equal highs need a tolerance #Shorts


These two highs are 373.29 and 373.28. They differ by no more than two cents. Calling them equal highs uses an explicit tolerance, rather than pretending every price is identical. The chart does not prove a stop cluster exists there. Treat the shared area as a reference and examine a later wick and close separately.

HPT educational replay using...

TSLA Equal Highs: Using a Two-Cent Tolerance

SNDK Long Lower Wick: Reading a 1-Minute Recovery

https://youtu.be/JLiXBWNZNvo

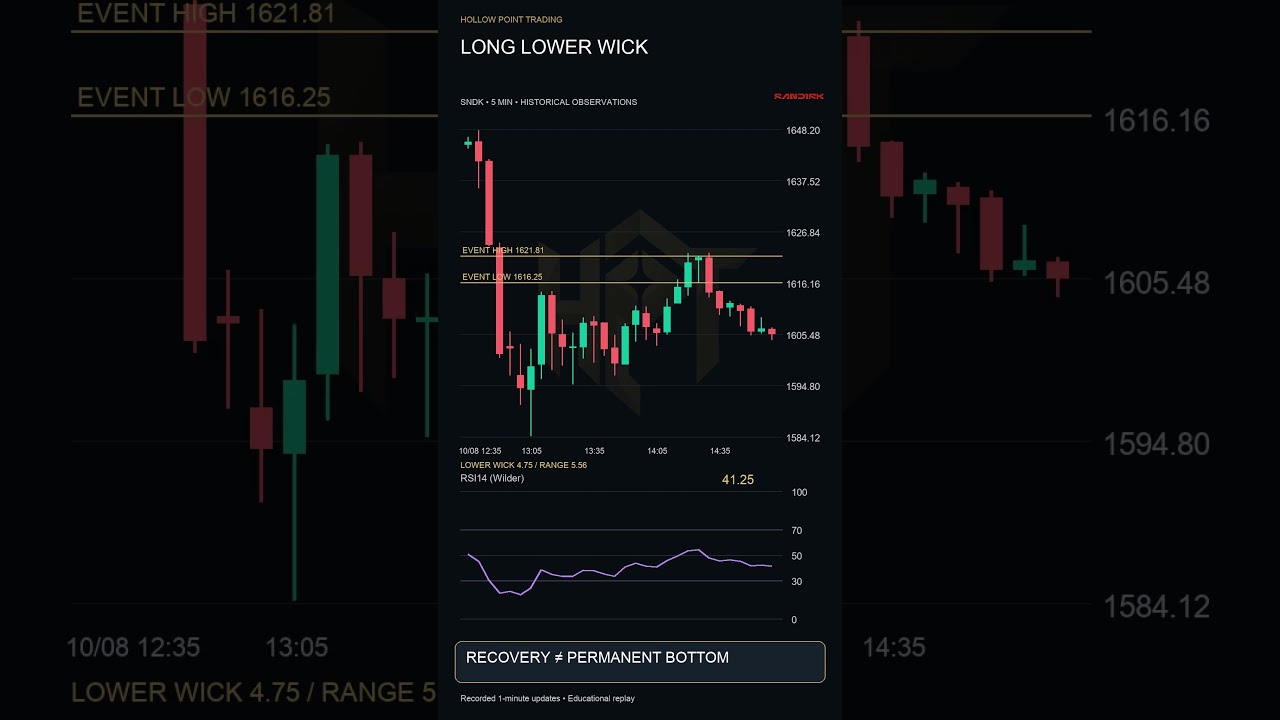
SNDK: Long lower wick #Shorts


This lower wick measures 4.75, out of a full range of 5.56. The final close sits above the interval low. That records a recovery inside this candle, not proof of a permanent bottom. Keep the actual low fixed. The following candles show whether the recovery holds or the low gets tested again.

HPT educational replay using recorded one-minute SNDK...

SNDK Long Lower Wick: Reading a 1-Minute Recovery

AAPL Opening Gap vs. Candle Range Explained

https://youtu.be/l4Gm8mtSCjc

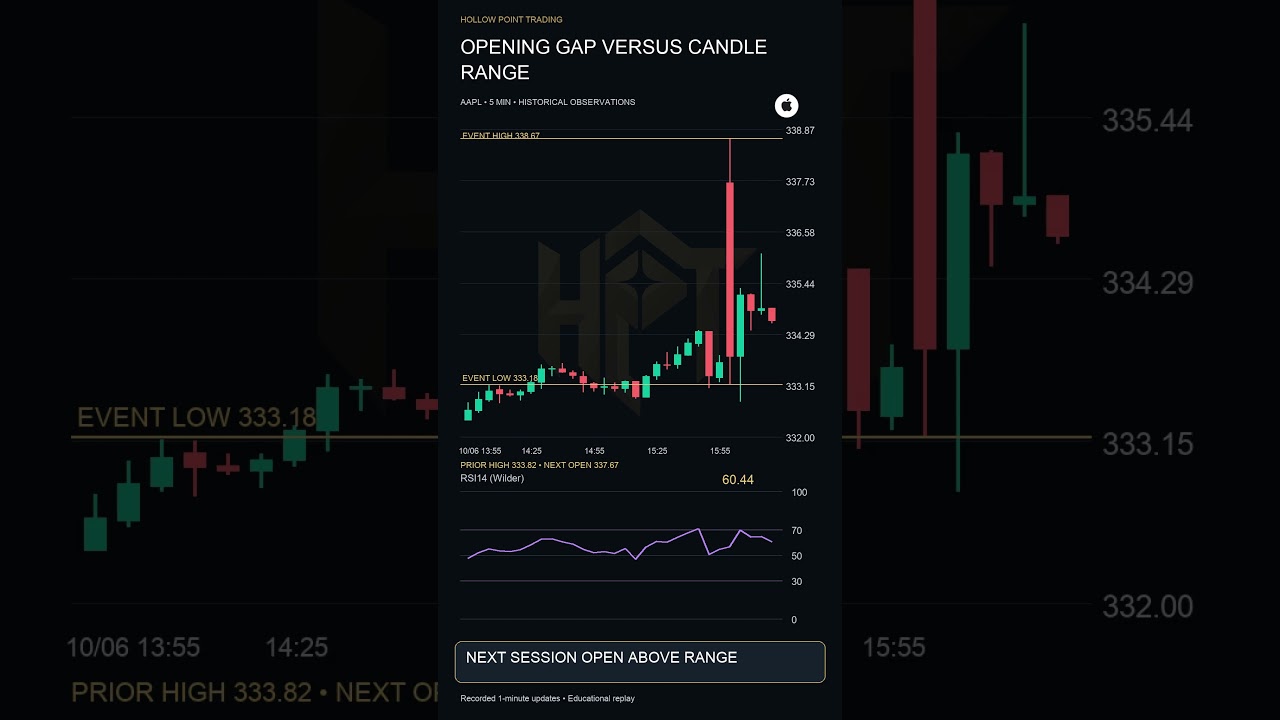
AAPL: Opening gap versus candle range #Shorts


The prior candle high is 333.82. After the session break, the next observed opening is 337.67, above that range. This is a gap between observations. It differs from a three candle fair value gap. Do not animate invented overnight ticks between them. Watch the new session response without assuming every gap must fill.

HPT educational replay usin...

AAPL Opening Gap vs. Candle Range Explained

TSLA Candlestick Body Size vs. Total Range Explained

https://youtu.be/cKNcp9qLQ4Q

TSLA: Body size versus total range #Shorts


The real body measures 0.24. The entire high to low range measures 0.32. Divide body by range: approximately 75 percent. A large body means the open and close are far apart relative to this candle. It does not measure individual buying or selling orders. Keep the completed candle fixed and compare what happens next.

Recorded one-minute observat...

TSLA Candlestick Body Size vs. Total Range Explained

AAPL Opening Gap Down: Why It Is Not an FVG

https://youtu.be/Xwm-43xATUA

AAPL: Opening gap down is not an FVG #Shorts


The prior candle low is 339.75. The next observed session opens at 331.79, below that low. This opening gap compares observations across a session break. A three candle fair value gap uses a different rule. Leave the missing interval empty. Follow the actual new session candles instead of inventing overnight movement or assuming a gap must fill....

AAPL Opening Gap Down: Why It Is Not an FVG

SNDK Candle Midpoint: A Key Price Reference

https://youtu.be/hYzTT9oC23k

SNDK: A candle midpoint is a reference #Shorts


This candle high is 1703.46, and its low is 1695.01. Add them and divide by two. The range midpoint is 1699.23. That is a price reference, not the average price of all trades. Compare the close with the midpoint and then watch the next response. The arithmetic alone cannot guarantee support or resistance.

Recorded one-minute observations aggreg...

SNDK Candle Midpoint: A Key Price Reference

How to Confirm a Three-Candle Swing High

https://youtu.be/avowj-yf0g8

Spot the Swing High—Which Candle Confirms the Pivot? #Shorts


In a three-candle swing high, the middle candle has a higher high than both neighbors. Wait for the right-hand candle to close before calling that structure confirmed. A historical pivot alone does not predict the next move.

Original Hollow Point Trading animation using an illustrative price sequence and HPT narration.

Free trading education: ...

How to Confirm a Three-Candle Swing High

Reading Directional vs. Overlapping Candles

https://youtu.be/qqBCQIj-KC0

Large Directional Candles or Small Overlapping Candles—What Chang...


Large candle bodies making directional progress differ from several small overlapping candles. Compare expansion with consolidation to describe the current price behavior. This lesson compares candle sequences, not a separate range-bar chart type.

Original Hollow Point Trading animation using an illustrative price sequence and HPT narration.

F...

Reading Directional vs. Overlapping Candles

Bullish Engulfing Candles: Spot Reversal Clues

https://youtu.be/k83aY-S_HF0

Bullish Engulfing: Compare the Bodies, Not Just the Wicks #Shorts


A bullish engulfing candle has an up body that covers the prior down body. After a decline, a strong close can add reversal evidence. Mark the pattern low and nearby resistance; the shape alone does not guarantee a bottom.

Original Hollow Point Trading animation using an illustrative price sequence and HPT narration.

Free trading education: ht...

Bullish Engulfing Candles: Spot Reversal Clues