Hollow Point Trading
Hollow Point Trading Discord server banner

Hollow Point Trading Updates & Events

Server Updates & Events

Upcoming Events

Announcements

Market Close Recap: PPI, TSMC and QQQ Tests

https://youtu.be/mc18zNCeYXI

WALL STREET SOLD THE RIP AND BOUGHT THE DIP HERE'S WHAT HAPPENS NEX...


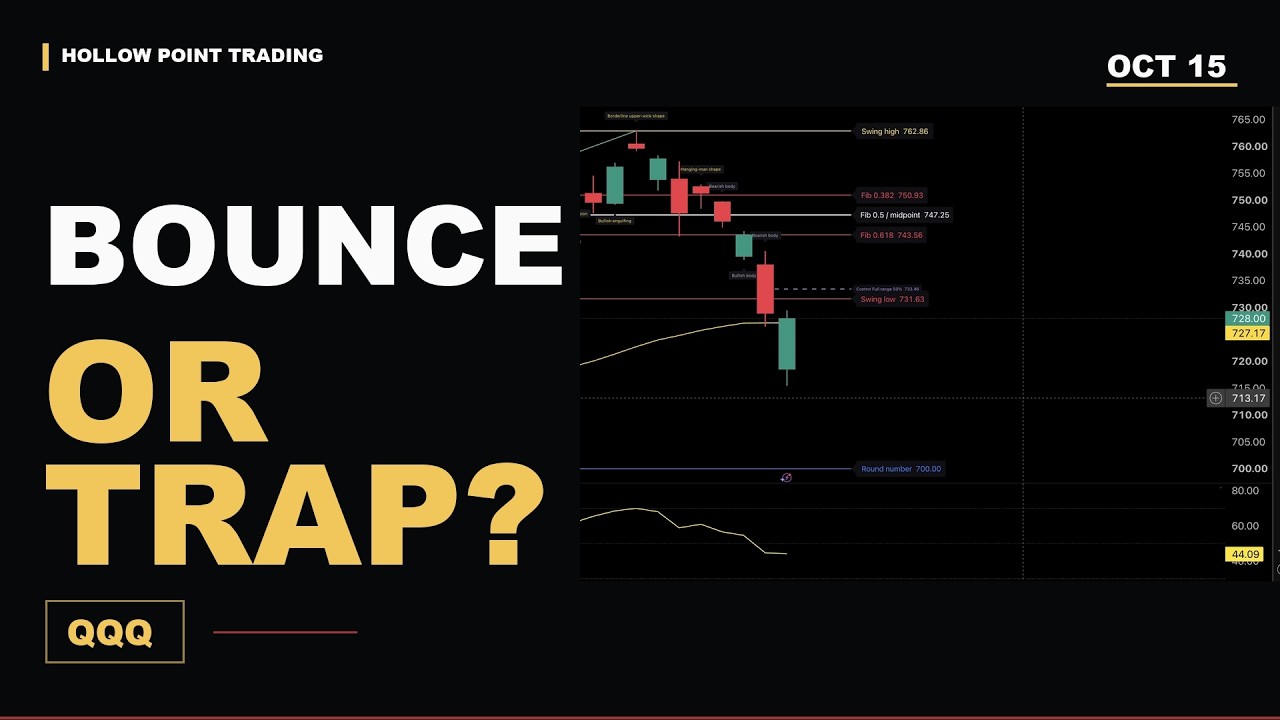
A hot producer-price report did not create one uniform market response. Equal weight and software recovered, semiconductors lagged, and Treasury yields eased. This October 15 closing recap connects the evidence to specific next-session tests in QQQ, SPY and SPX.

We cover September PPI, TSMC earnings, market breadth and its reporting lag, softwa...
Market Close Recap: PPI, TSMC and QQQ Tests

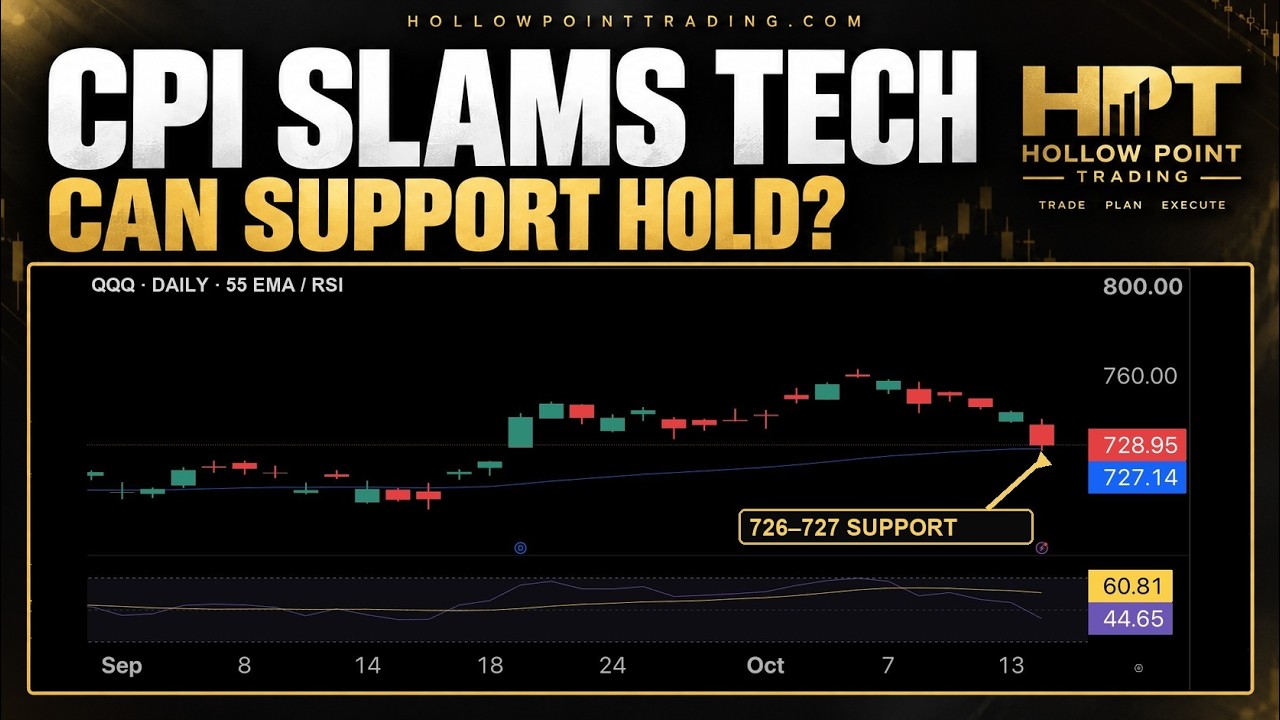
CPI Hits QQQ: Can Bulls Defend 726–727?

https://youtu.be/WnfNe36keFI

CPI Hit QQQ — Can Bulls Save This Level?


CPI hit QQQ. Can bulls defend the 726–727 area, or is the pressure beneath the market still too broad?

October 14, 2026 after-close HPT deep dive. We break down headline versus core CPI, energy and shelter, inflation momentum, the Fed, bond yields and equity valuations—then test that explanation against genuine TradingView charts, breadth, ...

CPI Hits QQQ: Can Bulls Defend 726–727?

Salesforce Piercing Pattern: Five-Minute Chart Replay

https://youtu.be/kDBW4FQy9Sw

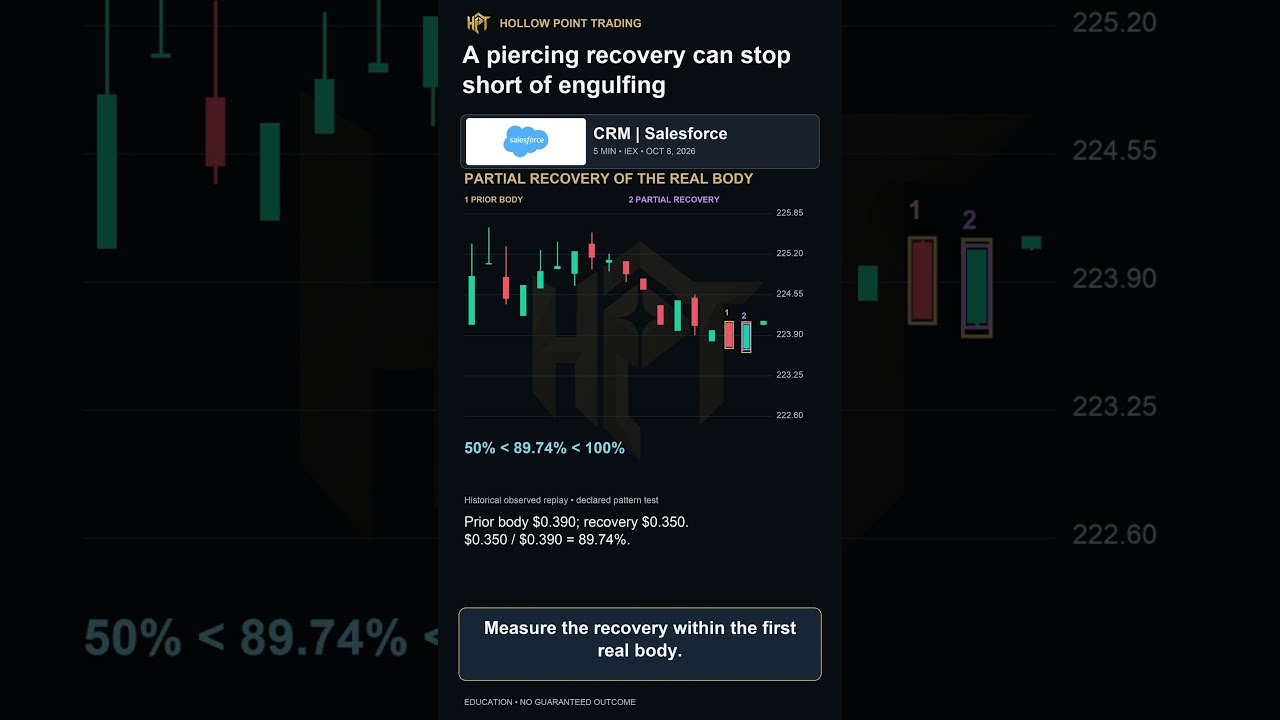
A piercing recovery can stop short of engulfing #CRM #PiercingPatte...


A piercing recovery can stop short of engulfing. This historical Salesforce replay uses completed five minute IEX bars from October eighth, twenty twenty six. The first candle falls from two twenty four point ten to two twenty three point seven one. The next opens at two twenty three point six nine, below the prior low, then closes at two twenty...

Salesforce Piercing Pattern: Five-Minute Chart Replay

Morning Star Screen: Why One Test Isn’t Enough

https://youtu.be/-yD7yghDWVw

Passing a midpoint test does not complete a morning-star screen #MC...


Passing one test does not complete a morning star screen. This historical McDonald’s replay uses completed five minute IEX bars from October eighth, twenty twenty six. The middle body is three and a half cents, one sixth of the first body. Its body gaps below the first, and the third close exceeds the first body midpoint. Those geometry checks...

Morning Star Screen: Why One Test Isn’t Enough

DE Inverted Hammer: Reading the Upper Shadow

https://youtu.be/6r5AHmWIHSU

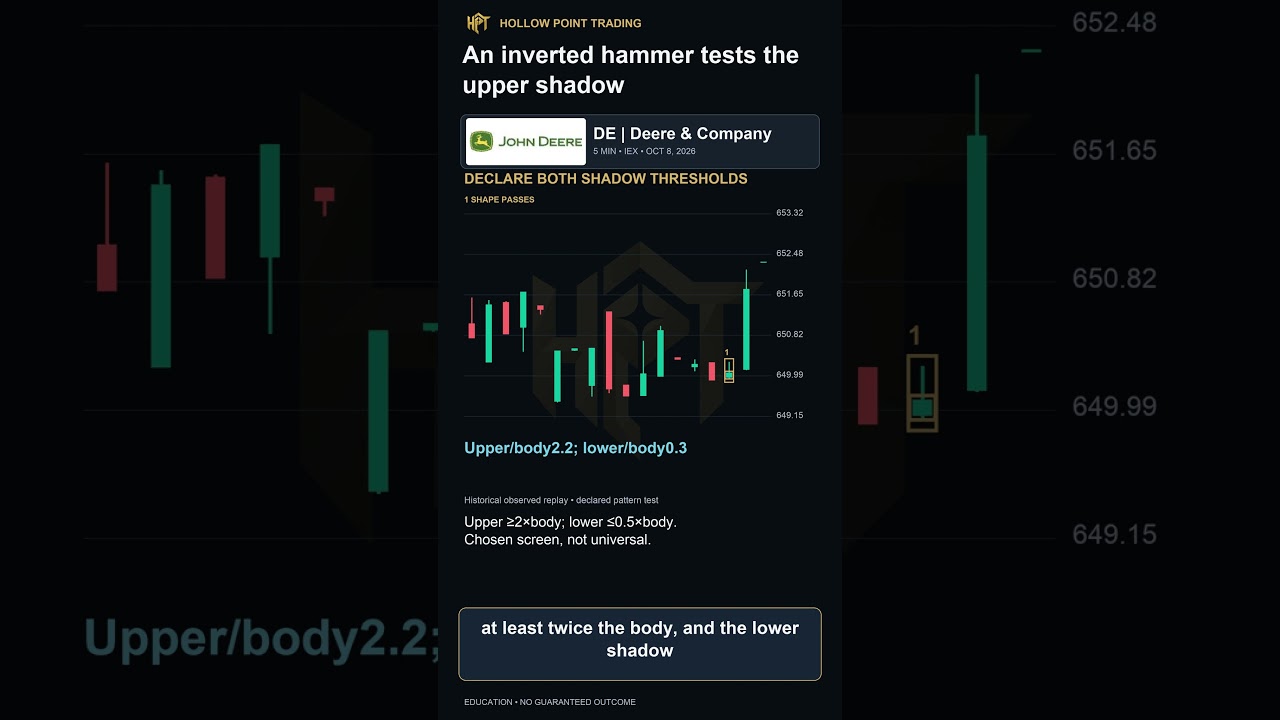
An inverted hammer tests the upper shadow #DE #InvertedHammer #Shorts


An inverted hammer tests the upper shadow, not the lower one. This historical Deere replay uses completed five minute IEX bars from October eighth, twenty twenty six. Three prior closes decline. The highlighted candle opens at six forty nine point nine five and closes at six fifty point oh five. Its high is six fifty point two seven and its low ...

DE Inverted Hammer: Reading the Upper Shadow

BAC Hammer Candlestick: When Confirmation Fails

https://youtu.be/qDX1NLe-zuY

A hammer shape can pass while confirmation fails #BAC #Hammer #Shorts


A hammer shape can pass while confirmation fails. This historical Bank of America replay uses completed five minute IEX bars from October eighth, twenty twenty six. Three prior closes decline. The highlighted candle has a three cent body, an eight and a half cent lower shadow, and no upper shadow. Our declared screen requires the lower shadow to...

BAC Hammer Candlestick: When Confirmation Fails

Range Bars: Why Three Bars Aren’t 15 Minutes

https://youtu.be/I66X8pIiM98

Three range bars do not mean fifteen minutes #RangeBars #ChartPatte...


Three range bars do not automatically mean fifteen minutes. A range chart builds bars from a chosen price movement, not a fixed five minute clock. Pattern length in bars and duration in minutes therefore answer different questions. Consider these hypothetical completion times. Range bars complete at nine thirty one, nine forty and nine forty two...

Range Bars: Why Three Bars Aren’t 15 Minutes

Why a Green BAC Candle Can Close Near Its Low

https://youtu.be/ViRn4YFpxlw

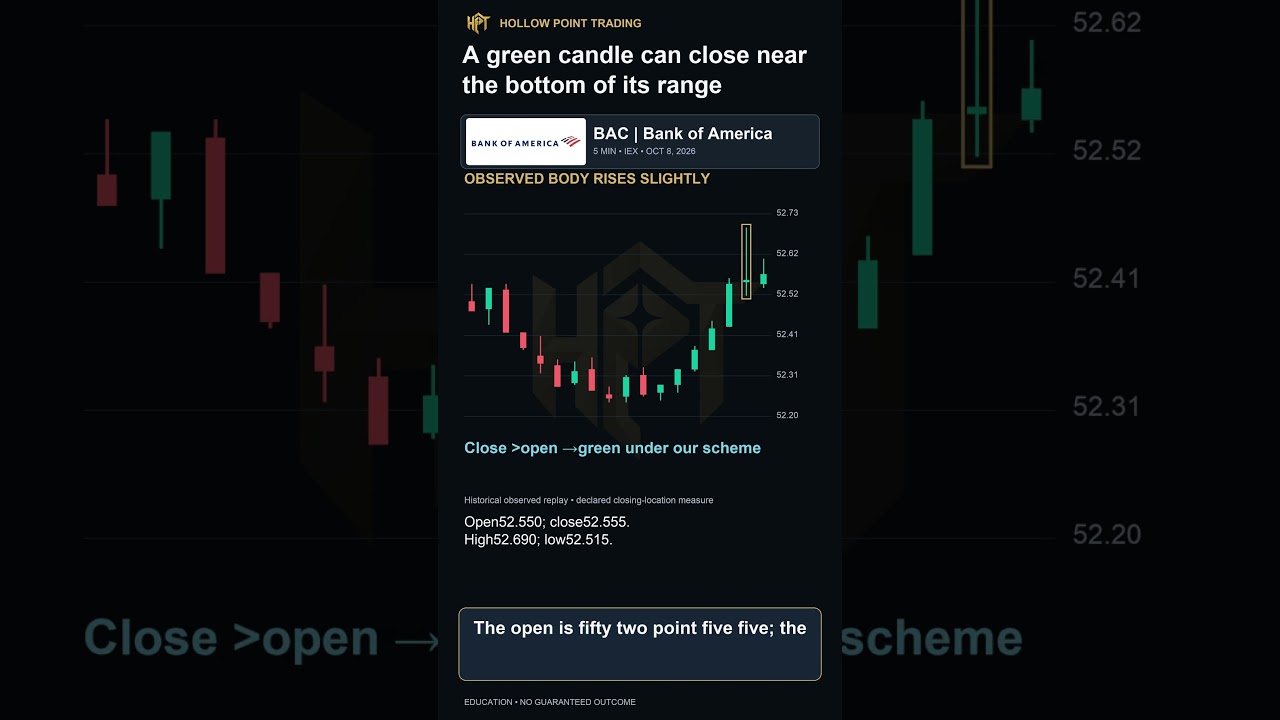
A green candle can close near the bottom of its range #BAC #Closing...


A green candle can close near the bottom of its range. Color compares the close with the open. Closing location instead compares the close with the low and high. This historical Bank of America IEX example uses a completed five minute candle from October eighth, twenty twenty six. The open is fifty two point five five; the close is fifty two poi...

Why a Green BAC Candle Can Close Near Its Low

TradingView Candle Colors: Previous Close vs. Open-Close

https://youtu.be/622GhaxCEns

The same candle can change color without changing prices #JNJ #Char...


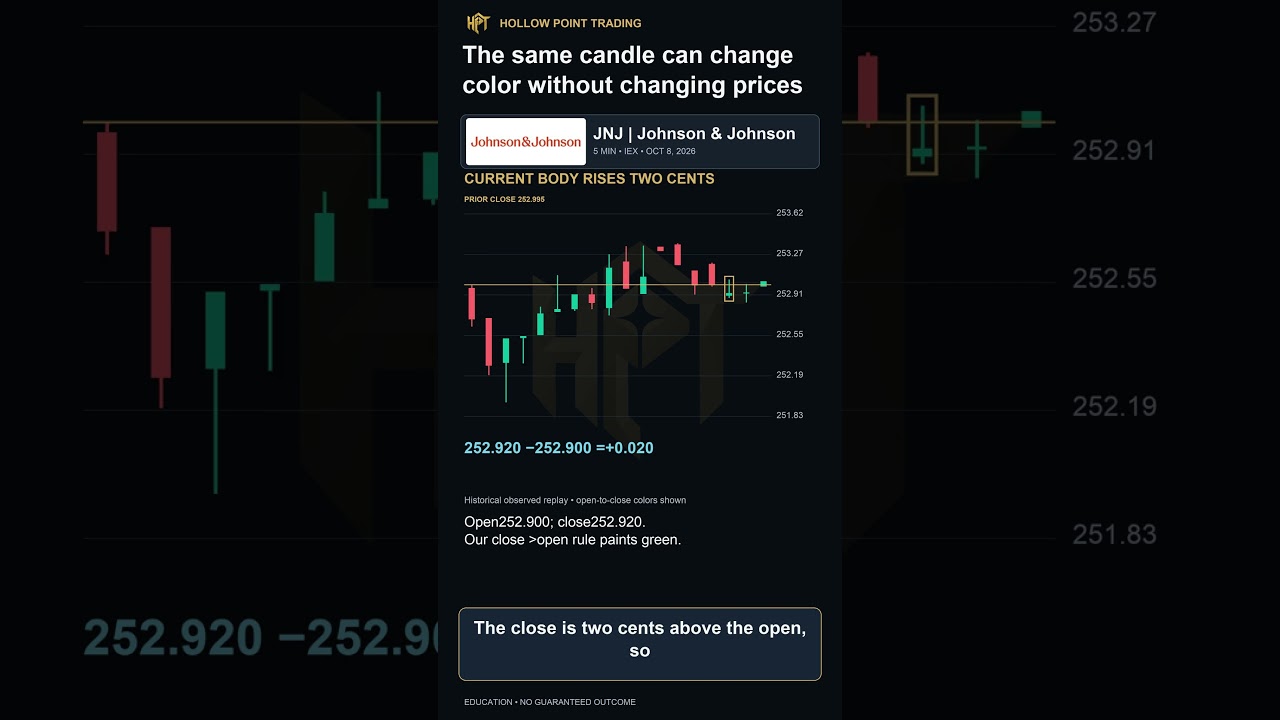
The same candle can change color without any price changing. Check which comparison controls the paint. TradingView offers a color bars based on previous close setting. This historical Johnson and Johnson IEX example keeps our usual open to close coloring on screen. The five minute candle opens at two fifty two point nine zero and closes at two ...

TradingView Candle Colors: Previous Close vs. Open-Close

Why a Green Candle Can Have a Falling Heikin Ashi Body

https://youtu.be/1dGjp47dq7U

A green real candle can have a falling Heikin Ashi body #AVGO #Heik...


A green real candle can still have a falling Heikin Ashi body. Its calculated open carries information from the previous calculated candle. This historical Broadcom IEX replay keeps standard five minute candles on screen. The highlighted real bar opens at three seventy point seven two and closes at three seventy one point three seven, so its bod...

Why a Green Candle Can Have a Falling Heikin Ashi Body

Why Adjacent Candles May Skip Time Intervals

https://youtu.be/3bPMbwXSNGs

Adjacent drawn candles may skip a time interval #DE #CandlestickPat...


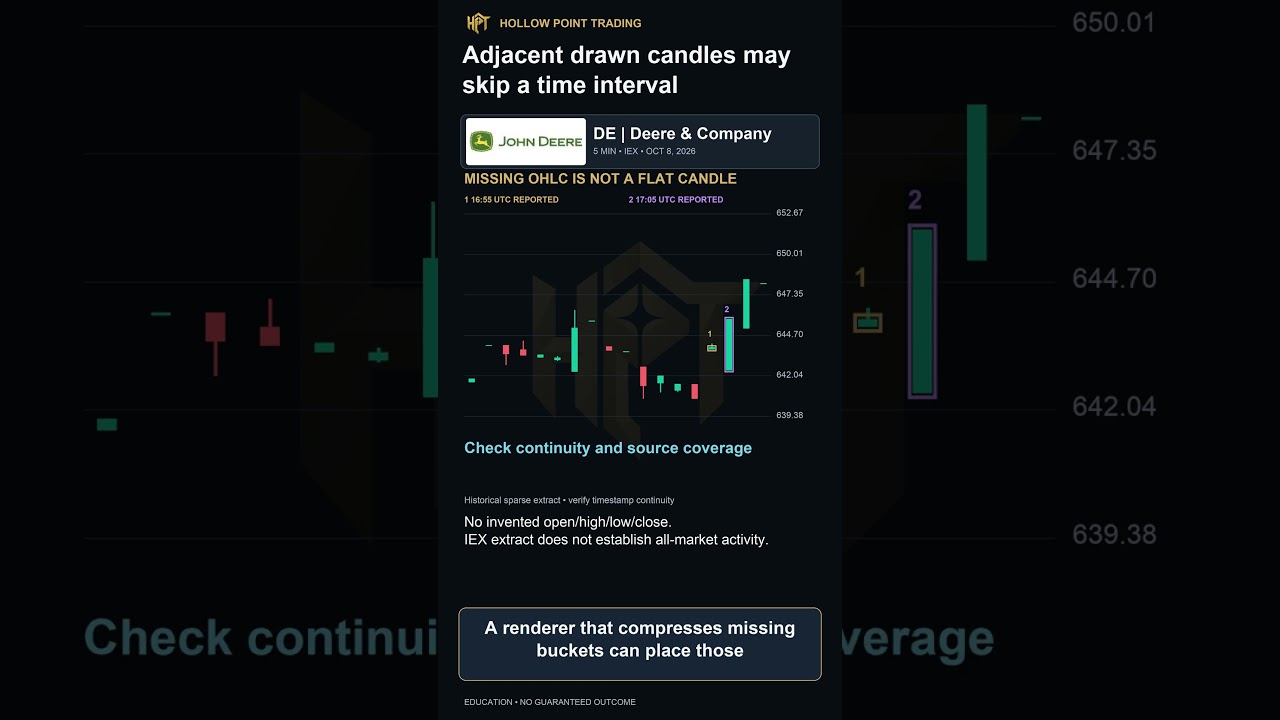
Two candles drawn next to each other are not always consecutive time intervals. Before testing a two candle pattern, check the timestamps and data coverage. This historical Deere IEX extract uses five minute buckets from October eighth, twenty twenty six. One reported bucket starts at sixteen fifty five UTC. The next reported bucket starts at se...

Why Adjacent Candles May Skip Time Intervals

Triangle Apex Is Not a Market Deadline: UPS Chart Analysis

https://youtu.be/wbeKpfI2s6s

A projected triangle apex is not a market deadline #UPS #TriangleAp...


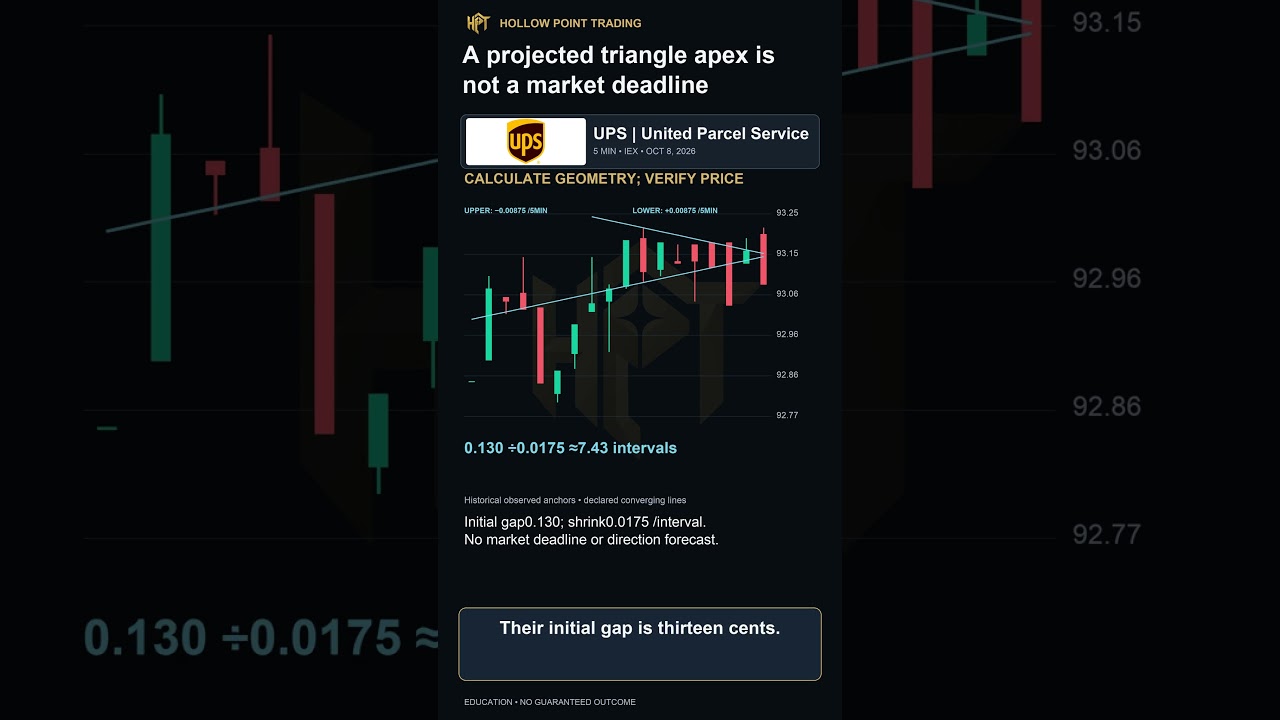
A projected triangle apex is a line intersection, not a deadline for the market. This historical UPS IEX example uses five minute candles from October eighth, twenty twenty six. We connect two declared observed highs and two lows, not a verified triangle formation. Four intervals apart, the highs fall from ninety three point two one five to nine...

Triangle Apex Is Not a Market Deadline: UPS Chart Analysis

AMZN Breakout Rule: Why a Wick Isn’t Enough

https://youtu.be/CfcPejPHrjI

A wick crossing does not pass a closing-price filter #AMZN #Breakou...


A wick crossing a line does not pass a closing price filter. First declare both the reference and the rule. This historical Amazon IEX example uses five minute candles from October eighth, twenty twenty six. We choose the previous completed high, two fifty eight point one five, as a reference, not proven resistance. Our illustrative rule require...

AMZN Breakout Rule: Why a Wick Isn’t Enough

Head and Shoulders Pattern: Projection vs. Trade Return

https://youtu.be/cQGMXer8hnA

Pattern height is not your trade return #ChartPatterns #MeasuredMov...


A pattern projection is not the return on your trade. Consider a labeled hypothetical head and shoulders example with a horizontal neckline at one hundred and a head at one hundred ten. The height is ten dollars. Subtract ten from the neckline for a rough projected price of ninety. That is a geometry reference, not a promised outcome. Now suppos...

Head and Shoulders Pattern: Projection vs. Trade Return

Why Pivot Labels Appear After the Candle

https://youtu.be/-nwYb1jpPFg

A pivot label can appear later than its candle #CRM #PivotConfirmat...


A pivot label can sit on an earlier candle even though the information arrived later. For a strict two left, two right high rule, the candidate high must exceed the highs of two completed bars on each side. The two right bars do not exist when the candidate first closes. This historical Salesforce IEX replay uses five minute candles from October...

Why Pivot Labels Appear After the Candle

Parallel Price Channels vs. Wedges: HON Chart Guide

https://youtu.be/g4MXB6OCK9A

Parallel lines do not squeeze into a wedge #HON #PriceChannels #Shorts


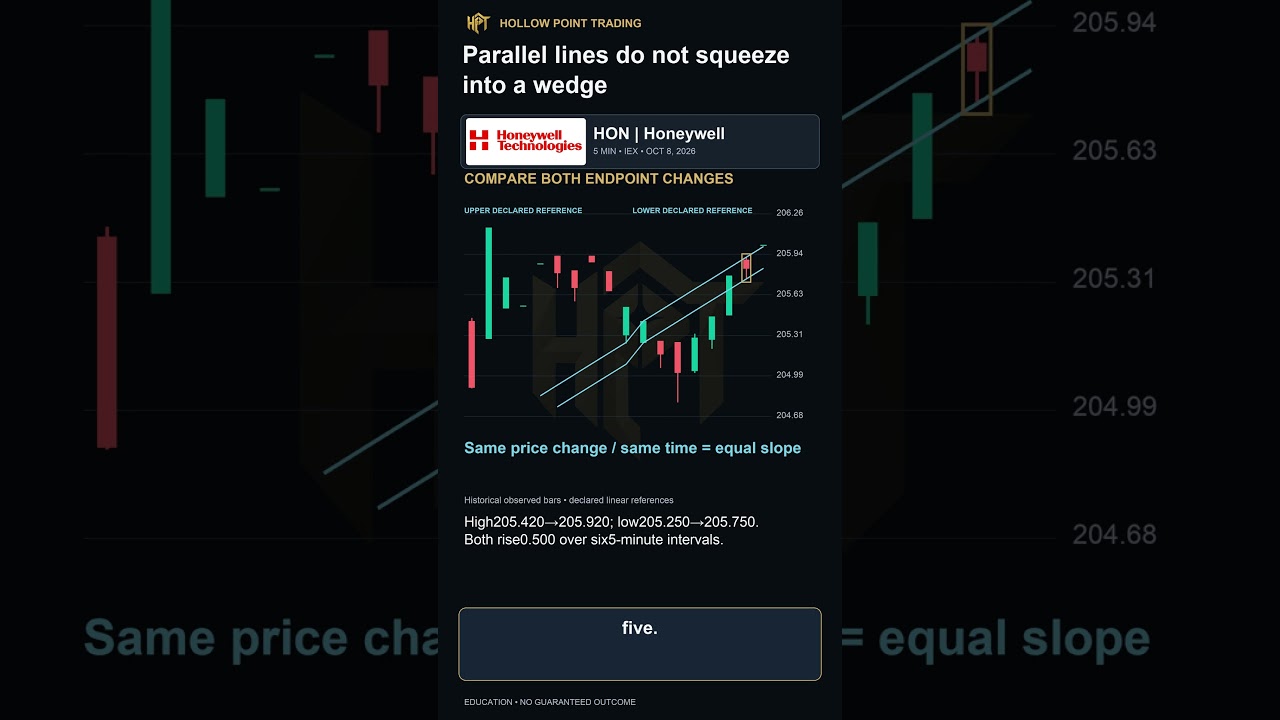
Parallel channel boundaries keep the same vertical price separation on a linear scale. Two lines can rise together without squeezing closer. Compare their slopes instead of calling every rising pair a wedge. This historical Honeywell IEX example uses two declared observed bars to demonstrate geometry, not a confirmed trading channel. The first h...

Parallel Price Channels vs. Wedges: HON Chart Guide

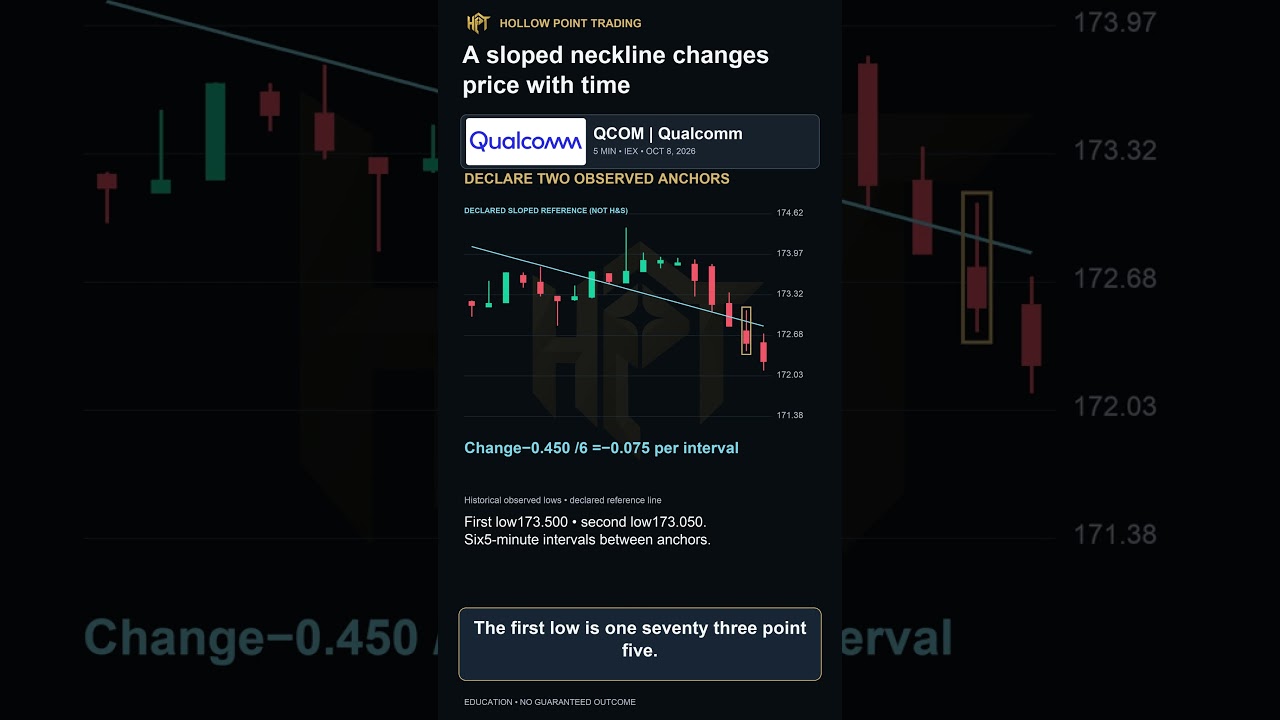
How a Sloped Neckline Changes Price Over Time

https://youtu.be/tLhgO5lTiAc

A sloped neckline changes price with time #QCOM #Neckline #Shorts


A sloped neckline does not have one fixed price. In a head and shoulders pattern, the neckline connects the reaction lows. If those lows differ, compare price with the line at the time being tested. This historical Qualcomm IEX example demonstrates the arithmetic with two declared observed lows, not a confirmed head and shoulders pattern. The fi...

How a Sloped Neckline Changes Price Over Time

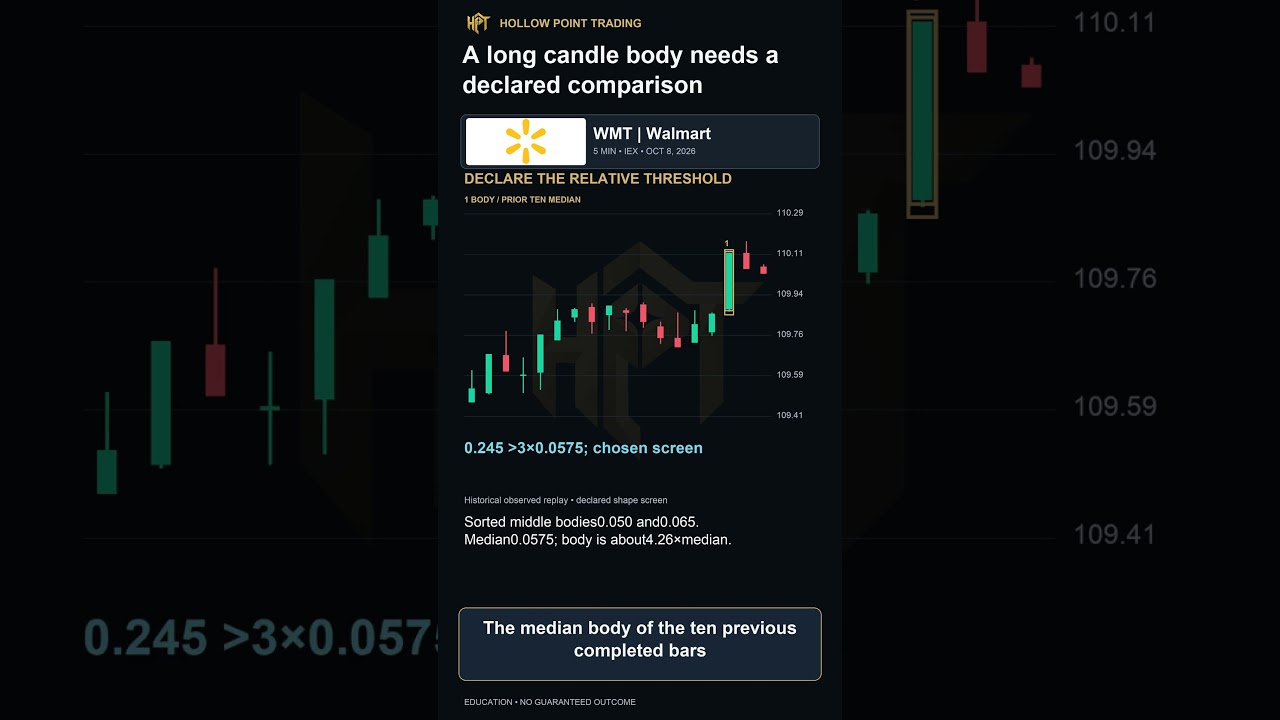
How to Measure a Long Candlestick Body

https://youtu.be/4pGPbQPa3eo

A long candle body needs a declared comparison #WMT #CandlestickBod...


Calling a candle long needs a comparison. A twenty five cent body can be large beside recent candles and ordinary in another setting. Use a declared reference window instead of judging only its screen height. This historical Walmart IEX replay uses completed five minute bars from October eighth, twenty twenty six. The highlighted candle opens at...

How to Measure a Long Candlestick Body

Rising Three Methods: The Fifth Candle Rule

https://youtu.be/1A0b9oIEg7U

Rising three methods needs the fifth candle close #CAT #RisingThree...


Rising three methods is a five candle continuation formation, not just three small candles after a rally. Its definition includes an initial rising body, three smaller bodies contained within the first high to low range, and a fifth candle closing at a new high. Do not skip the final condition. This historical Caterpillar IEX replay uses complet...

Rising Three Methods: The Fifth Candle Rule

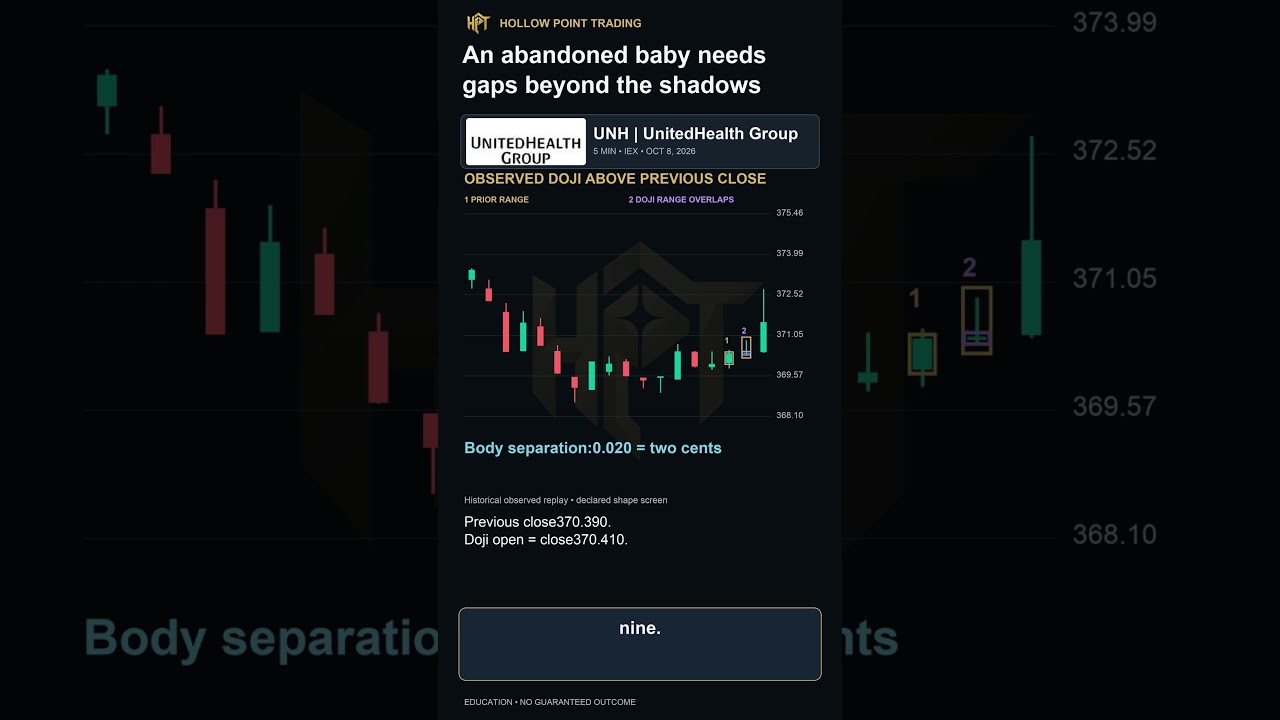
Abandoned Baby Candlestick Pattern: Gap Rules Explained

https://youtu.be/A7LgGiXQGRA

An abandoned baby needs gaps beyond the shadows #UNH #AbandonedBaby...


An abandoned baby needs more than a doji whose body sits above the previous close. In this definition, the middle doji must be isolated from both neighboring candles by gaps between their full ranges, including shadows. Body separation alone is insufficient. This historical UnitedHealth IEX replay uses completed five minute bars from October eig...

Abandoned Baby Candlestick Pattern: Gap Rules Explained

How Spinning Tops Reveal Hidden Price Volatility

https://youtu.be/LbpTtzQ9Rgc

A spinning top can hide a wide price range #CRM #SpinningTop #Shorts


A spinning top can finish nearly unchanged while covering a much wider price range. The real body measures open to close. The shadows measure the extremes beyond that body. A small net change does not mean a quiet interval. This historical Salesforce IEX replay uses completed five minute bars from October eighth, twenty twenty six. The open is t...

How Spinning Tops Reveal Hidden Price Volatility

Green Hanging Man: UPS Chart Pattern Explained

https://youtu.be/P_RSf6Q7xFI

A hanging man candidate can still be a green candle #UPS #HangingMa...


A green hanging man candidate is not a contradiction. Green means the close is above the open. It does not promise a bullish future. A small body with a long lower shadow after an advance can instead raise a reversal question. This historical UPS IEX replay uses completed five minute bars from October eighth, twenty twenty six. The highlighted c...

Green Hanging Man: UPS Chart Pattern Explained

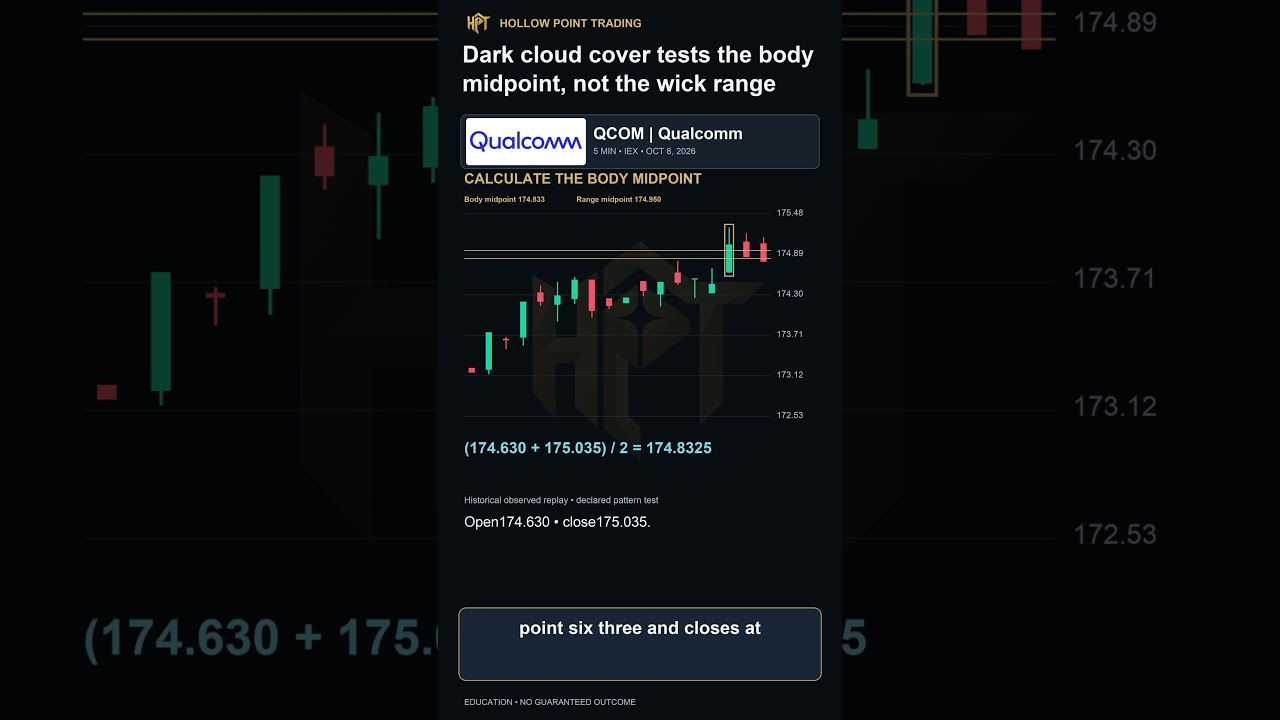
Dark Cloud Cover: The Real Body Midpoint Explained

https://youtu.be/RplxILkK5-4

Dark cloud cover tests the body midpoint, not the wick range #QCOM ...


For dark cloud cover, the midpoint test refers to the previous real body, not its full high low range. The real body runs between the open and close. Wicks are separate. This historical Qualcomm IEX example uses completed five minute candles from October eighth, twenty twenty six. The first rising candle opens at one seventy four point six three...

Dark Cloud Cover: The Real Body Midpoint Explained

Three Green Candles: Spotting Three White Soldiers

https://youtu.be/xsy9ksw3388

Three green candles do not automatically make three soldiers #CAT #...


Three green candles are not automatically three white soldiers. The conventional formation also checks long bodies, later opens inside the previous body, closes near the highs and trend context. Counting colors alone skips those tests. This historical Caterpillar IEX replay uses completed five minute candles from October eighth, twenty twenty si...

Three Green Candles: Spotting Three White Soldiers

Marubozu Candlestick: What It Does—and Doesn’t—Prove

https://youtu.be/jJf96scdNTA

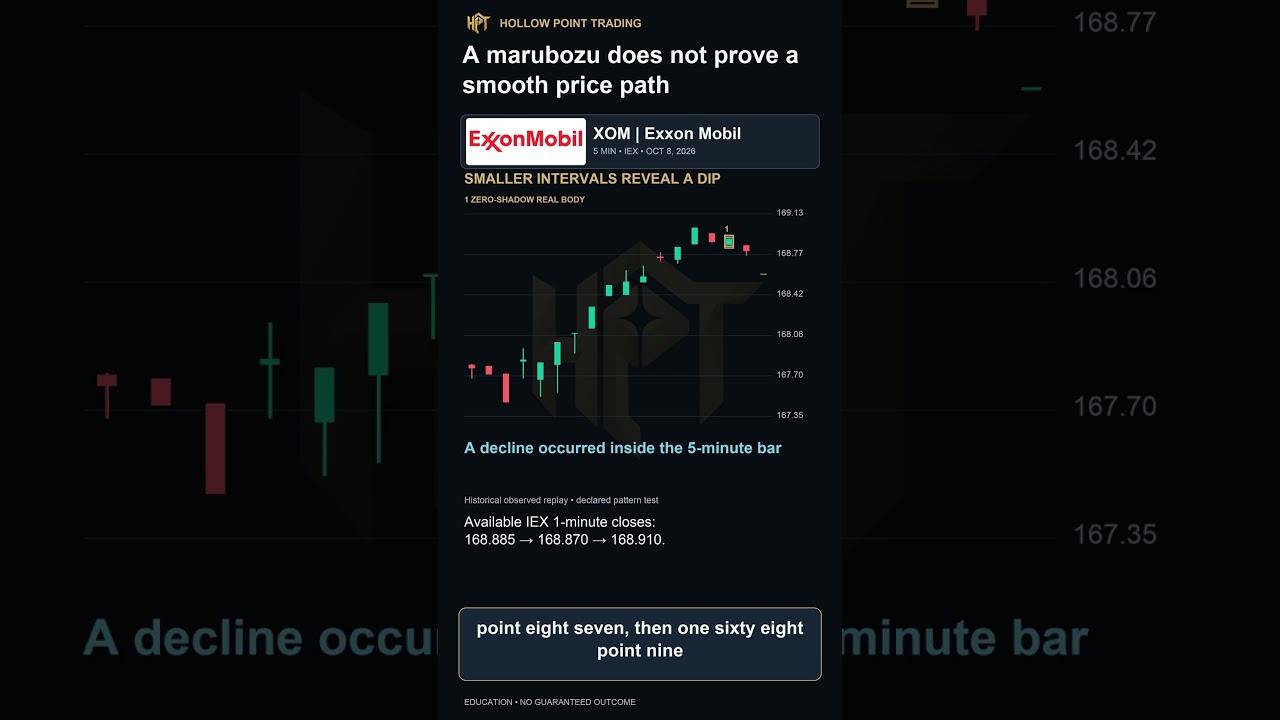
A marubozu does not prove a smooth price path #XOM #Marubozu #Candl...


A marubozu does not prove that price moves smoothly in one direction. A bullish marubozu opens at its low and closes at its high, leaving no shadows. This historical Exxon Mobil IEX example uses a completed five minute bar from October eighth, twenty twenty six. Open and low are one sixty eight point eight five five. Close and high are one sixty...

Marubozu Candlestick: What It Does—and Doesn’t—Prove