NDFI vs. S5FI: Read Market Breadth Like a Pro
Zusammenfassung
Hollow Point Trading explains how NDFI and S5FI measure the share of Nasdaq-100 and S&P 500 stocks above their 50-day moving averages. Comparing the indicators can show where market participation is stronger and whether an index move is broadening; the chart example is historical and educational.
https://youtu.be/QlSy7s3Kquc
Two Charts Pro Traders Use | NDFI & S5FI
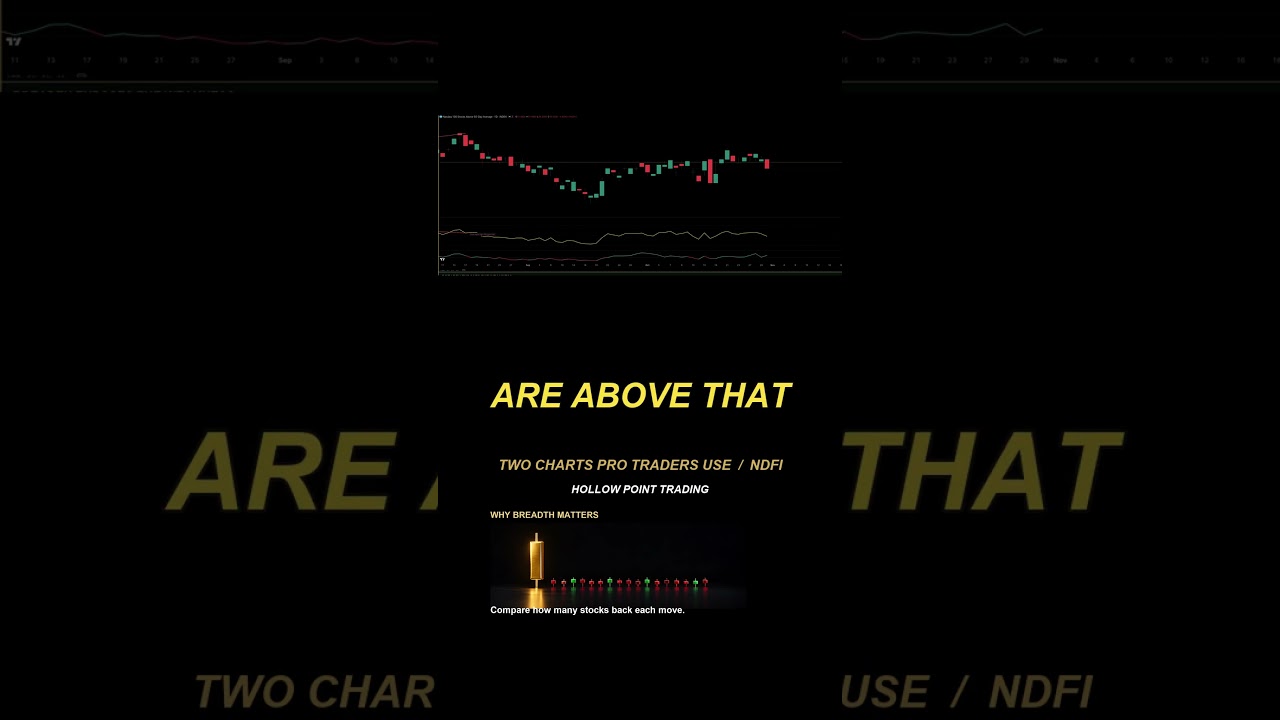
NDFI and S5FI measure how many Nasdaq-100 and S&P 500 stocks are above their 50-day moving averages. Compare them to see where participation is stronger and whether an index move is broadening.
Historical chart example. Candle graphic is illustrative. Educational only.