Hollow Point Trading
Hollow Point Trading Discord server banner

Hollow Point Trading Updates & Events

Server Updates & Events

Announcements

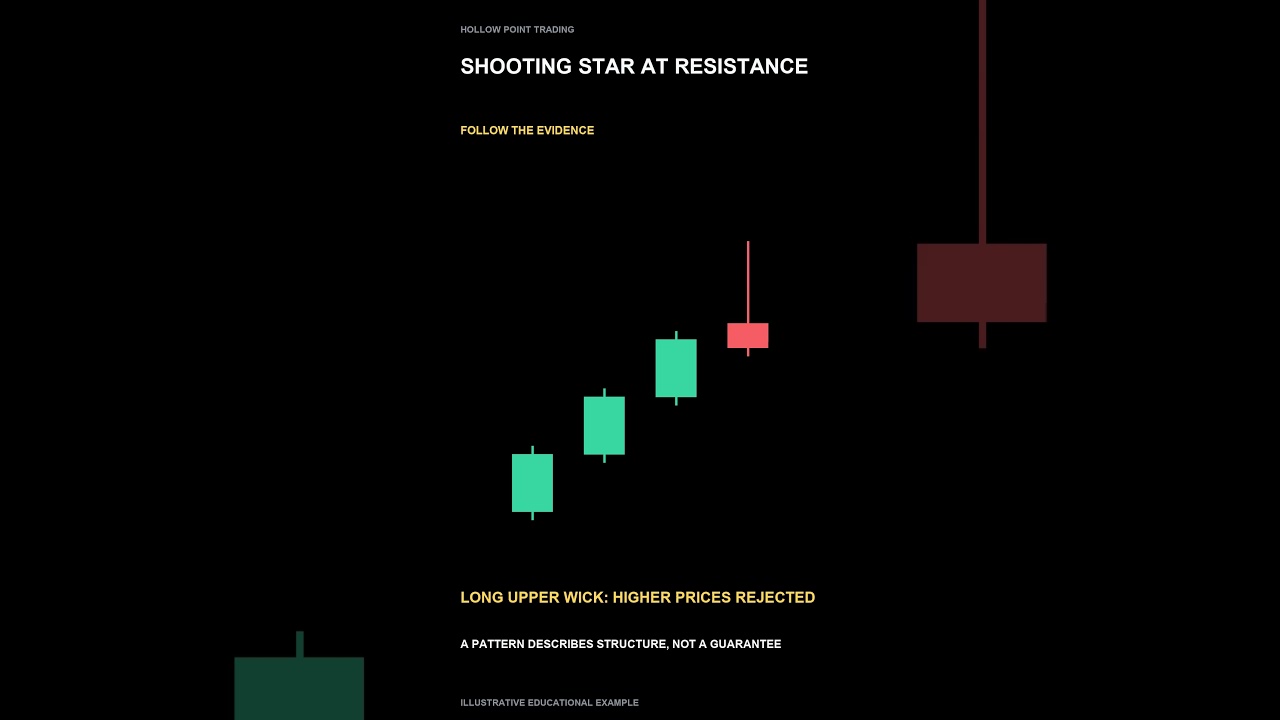
Shooting Star Candlestick: Spot the Long Upper Wick

https://youtu.be/S7pCDWmr_Is

Shooting Star: Find the Long Upper Wick and Check the Trend #Shorts


A shooting star has a long upper wick and a small body near the bottom of its range. Context matters: compare it with the preceding uptrend and nearby resistance, then watch for confirmation rather than assuming a reversal.

Original Hollow Point Trading animation using an illustrative price sequence and HPT narration.

Free trading education: h...
Shooting Star Candlestick: Spot the Long Upper Wick

Hammer Candles: Does Support Confirm the Pattern?

https://youtu.be/X8drwqFzTZk

Hammer Candle: Does the Location Support the Pattern? #Shorts


A hammer has a long lower wick and a small body near the top of its range. After a decline near support it offers different context than the same shape inside a sideways range. Compare location and subsequent confirmation.

Original Hollow Point Trading animation using an illustrative price sequence and HPT narration.

Free trading education: ht...

Hammer Candles: Does Support Confirm the Pattern?

Doji Candlestick: Why Context Matters

https://youtu.be/lwFx0flqsoQ

Doji: Tiny Body, Big Context—Where Did It Form? #Shorts


A doji forms when the open and close are almost the same, leaving a tiny body. Compare its location after a sustained move with the same shape inside sideways price action. Indecision alone does not choose the next direction.

Original Hollow Point Trading animation using an illustrative price sequence and HPT narration.

Free trading education:...

Doji Candlestick: Why Context Matters

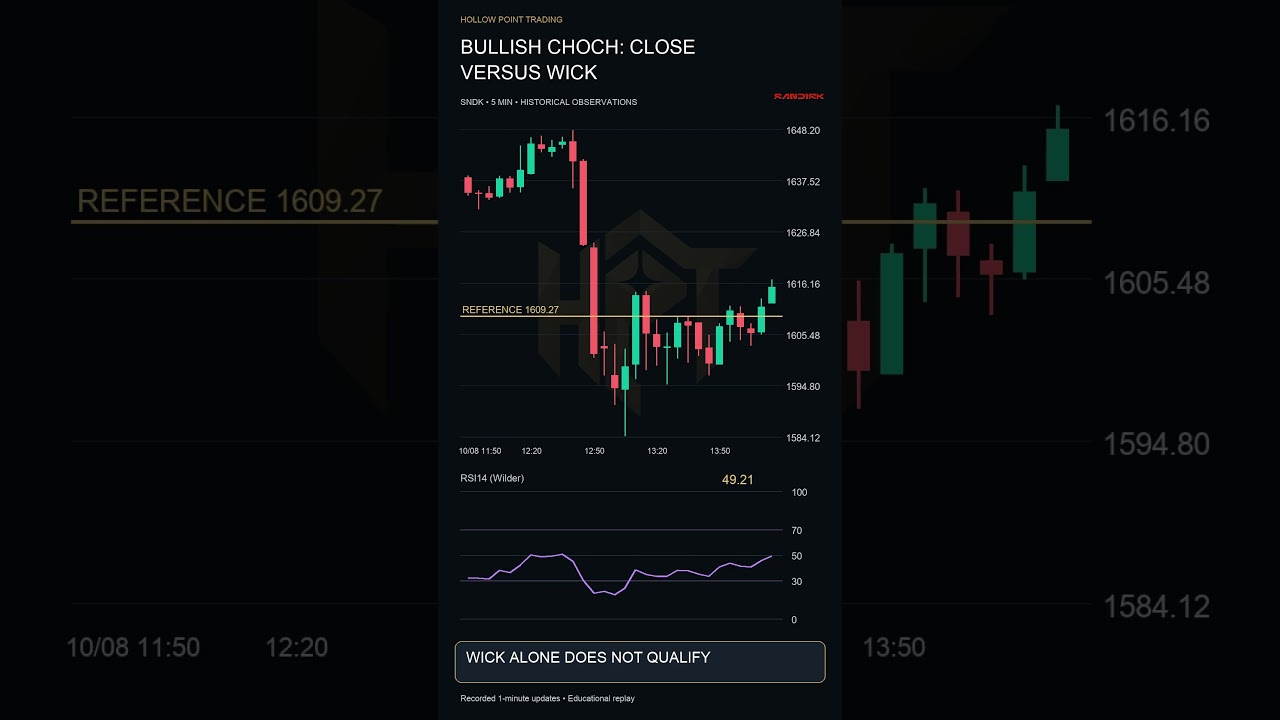
SNDK Bullish CHoCH: Candle Close vs. Wick

https://youtu.be/OaDAZVF_TSM

Sandisk: Bullish CHoCH: close versus wick #Shorts


Bullish CHoCH on SNDK. First identify the confirmed swings: lower highs and lower lows. The gold line marks the relevant swing high at 1609.27. Now watch a completed candle close above that fixed level. Under this definition, that break challenges the preceding structure. It is an early change, not a completed reversal. A wick alone does not mee...

SNDK Bullish CHoCH: Candle Close vs. Wick

Ichimoku Tenkan-Kijun Cross: Read the Evidence

https://youtu.be/_T_LOQ3kjLs

Ichimoku Tenkan Kijun Cross — Read the Evidence #Shorts


The conversion line crosses above the base line. Is that enough? In the standard settings, they are the midpoints of nine and twenty six period high low ranges. Their cross describes changing range midpoints. Compare its location with price and the cloud. A cross above the cloud has different context from one trapped inside it.

Recorded SPY one...

Ichimoku Tenkan-Kijun Cross: Read the Evidence

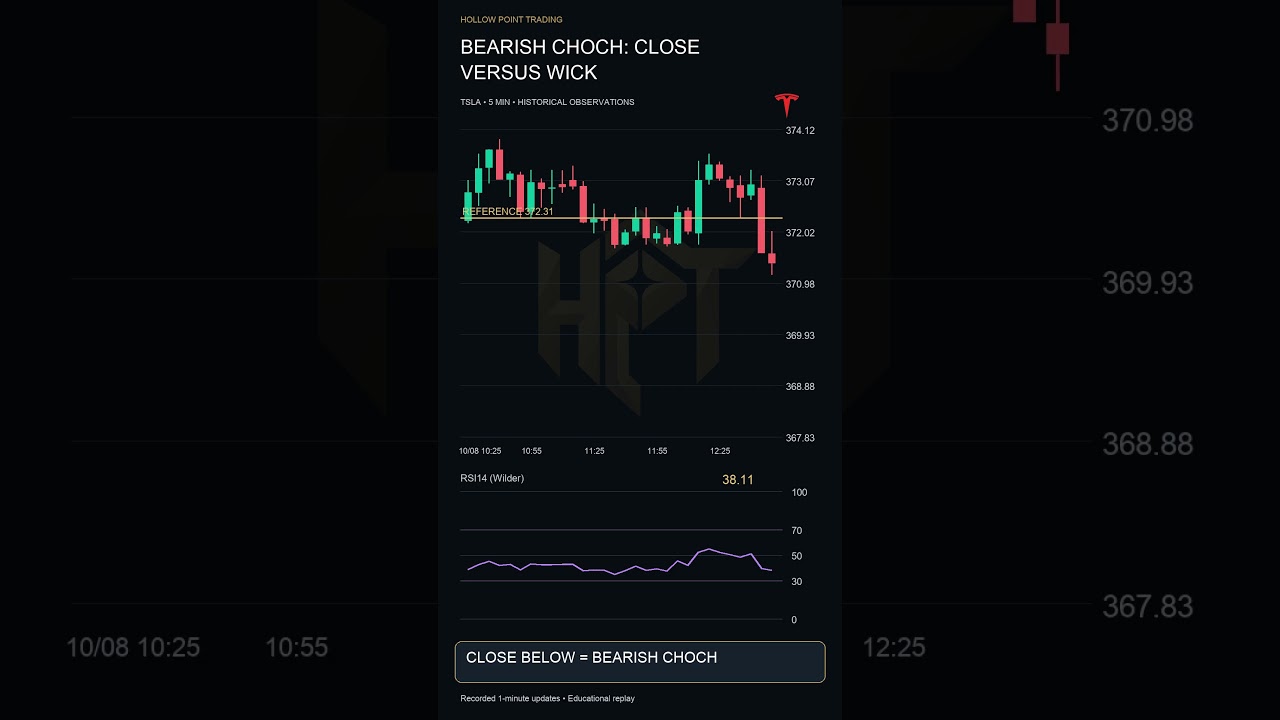
TSLA Bearish CHoCH: Why Candle Closes Matter

https://youtu.be/XHMvO3ZsRMs

Tesla: Bearish CHoCH: close versus wick #Shorts


Bearish CHoCH on TSLA. First identify the confirmed swings: higher highs and higher lows. The gold line marks the relevant swing low at 372.31. Now watch a completed candle close below that fixed level. Under this definition, that break challenges the preceding structure. It is an early change, not a completed reversal. A wick alone does not mee...

TSLA Bearish CHoCH: Why Candle Closes Matter

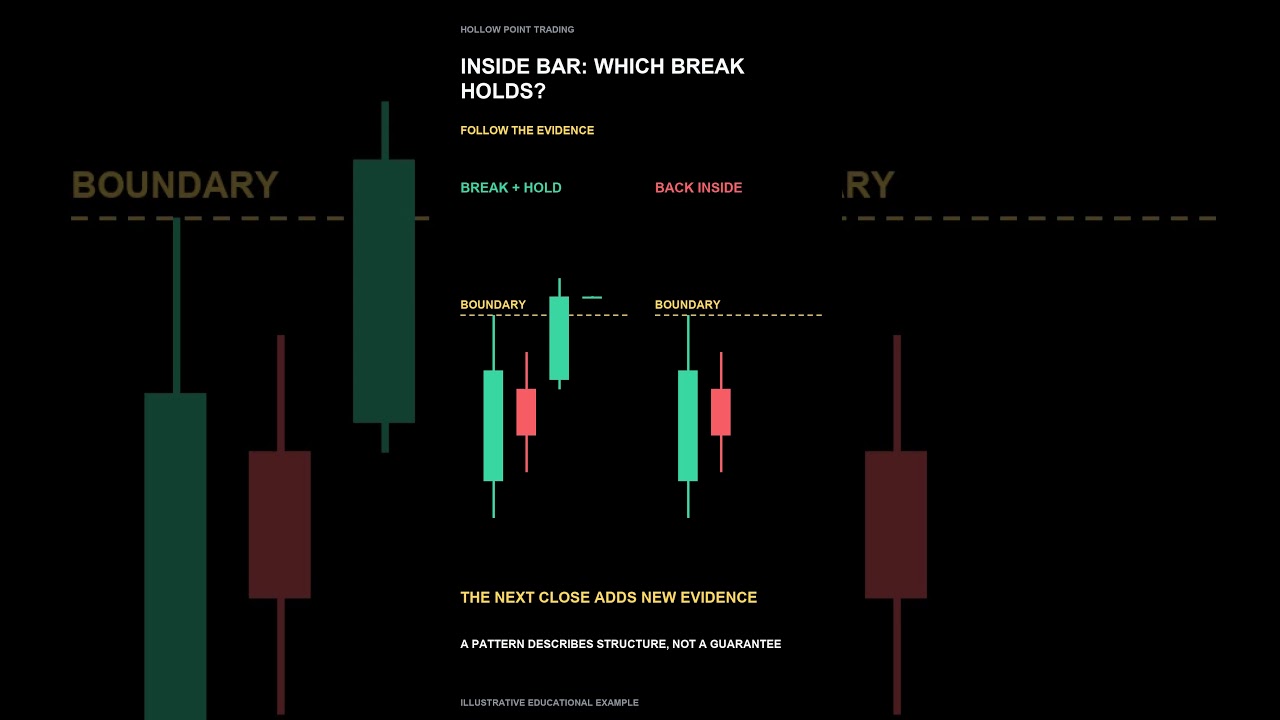
Inside Bar Trading: What Range Contraction Reveals

https://youtu.be/zDupskXLS98

Inside Bar: Range Contraction Does Not Pick the Next Direction #Shorts


An inside bar has a high below the previous high and a low above the previous low. Mark the larger bar’s boundaries. A later break and hold provides different evidence from a break that returns inside; the smaller candle alone does not pick a direction.

Original Hollow Point Trading animation using an illustrative price sequence and HPT narra...

Inside Bar Trading: What Range Contraction Reveals

How to Read a Candlestick: Open, High, Low & Close

https://youtu.be/OdJg-NC5NQM

Read a Candlestick: Open, High, Low and Close in One Bar #Shorts


A candle summarizes four prices: open, high, low and close. Its body joins the open and close, while the wick tips mark the extremes. Changing the chart timeframe changes the interval each candle summarizes. Read the structure before predicting the next move.

Original Hollow Point Trading animation using an illustrative price sequence and HPT n...

How to Read a Candlestick: Open, High, Low & Close

RSI Crosses 50: Confirm a Price Breakout

https://youtu.be/jLovXyTUygk

RSI Crosses 50: Confirm the Price Breakout #Shorts


What changes when RSI crosses fifty? The balance of smoothed recent gains and losses has shifted. Now compare the oscillator with price clearing its local range. Those are two different observations. A midline cross inside sideways chop can fail repeatedly. Watch the price boundary and its next retest before assuming a new trend.

HPT educationa...

RSI Crosses 50: Confirm a Price Breakout

Ichimoku Cloud Breakout: Close vs. Wick

https://youtu.be/hVEOoBajoGQ

Ichimoku Cloud Breakout: A Close Versus a Wick #Shorts


Price has closed above the cloud. What exactly changed? The close moved beyond the upper cloud boundary on this chart. That is different from a wick briefly poking through. Check the trend context and the next test of the boundary. A cloud breakout can fail; its appearance is evidence to evaluate, not a promise.

HPT educational replay. Recorded...

Ichimoku Cloud Breakout: Close vs. Wick

Ichimoku Cloud Rejection: Spotting a Failed Rally

https://youtu.be/ahMUGv-8WvA

Ichimoku Cloud Rejection: Watch the Rally Fail #Shorts


Price rallies toward the underside of the cloud, then closes back below it. Watch the rejection candle and the following swing. The cloud is a calculated reference area, not a physical ceiling. If price later reclaims it, the earlier bearish interpretation needs updating. Follow the evidence rather than defending the first signal.

HPT education...

Ichimoku Cloud Rejection: Spotting a Failed Rally

How to Spot the Real Morning Star Candlestick

https://youtu.be/MRaIZGAl8nE

Which Is the Real Morning star? Choose Before the Reveal #Shorts


Can you spot the morning star before the answer appears? Look for a long red body, a small middle body, then a green close deep into the first body. Compare both examples carefully. One misses a defining feature. The correct shape is the starting point, not a prediction. Check the preceding trend and the next price response before drawing a conc...

How to Spot the Real Morning Star Candlestick

RSI Above 70? Why Overbought Doesn’t Mean Sell

https://youtu.be/9FnSHxZYBHo

RSI Above 70: Why Overbought Does Not Mean Sell #Shorts


RSI is above seventy. Would you sell just because of that? Watch price continue higher while the oscillator stays elevated. Overbought describes recent momentum; it does not set an expiration date on a trend. Compare the next pullback with the previous higher low. A loss of structure adds evidence that the threshold alone cannot provide.

HPT ed...

RSI Above 70? Why Overbought Doesn’t Mean Sell

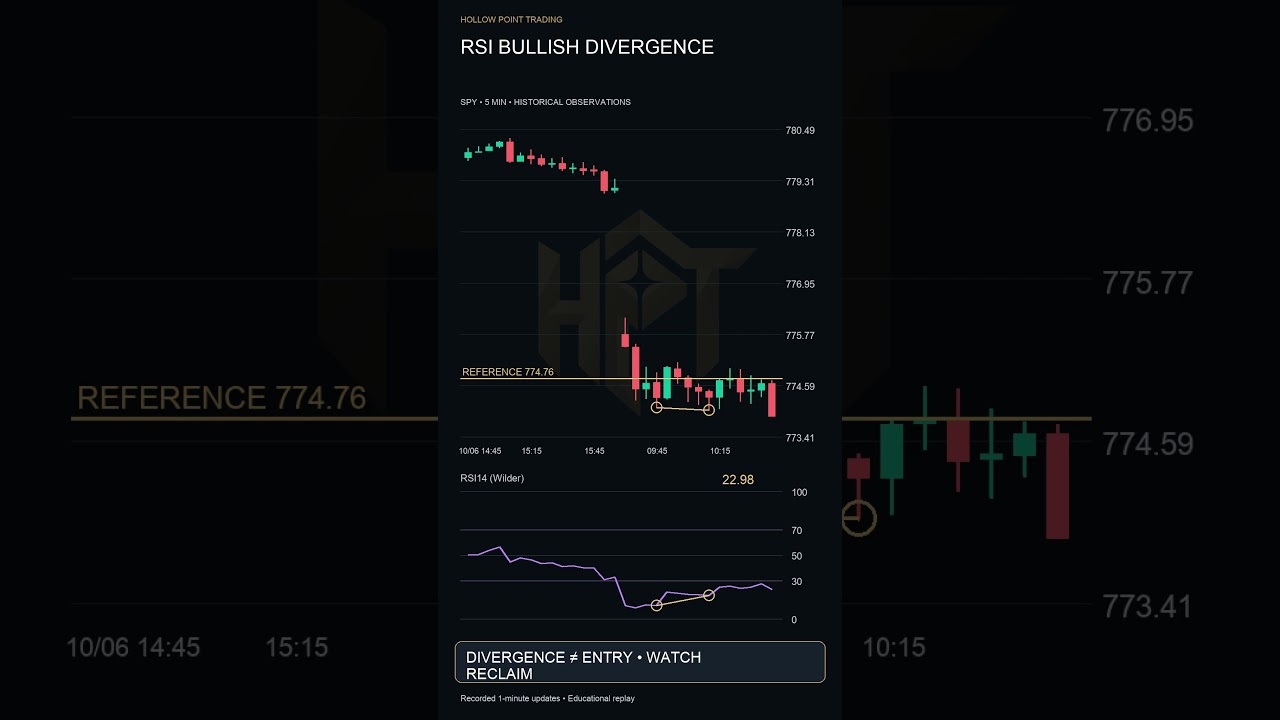
Bullish RSI Divergence: Wait for Price Confirmation

https://youtu.be/qdltck1_4Cs

Bullish RSI Divergence: Why Price Confirmation Matters #Shorts


Price makes a lower low. Underneath, RSI makes a higher low at the matching swing. That is bullish divergence. Momentum is no longer confirming the new price extreme. But price can keep falling. Look for a defined level to reclaim instead of treating the divergence itself as a guaranteed entry.

HPT educational replay using recorded one-minute S...

Bullish RSI Divergence: Wait for Price Confirmation

Bearish RSI Divergence: Spot the Key Swing Pair

https://youtu.be/rWhbloV6T-8

Bearish RSI Divergence: Match These Two Swings #Shorts


Which pair matters here? Price makes a higher swing high, while RSI makes a lower swing high at the corresponding times. That is bearish divergence. It describes weaker momentum behind the later price high. It does not guarantee an immediate reversal. Keep the swing points aligned, then watch whether price actually loses support.

HPT educationa...

Bearish RSI Divergence: Spot the Key Swing Pair

RSI Below 30? Why Oversold Doesn’t Guarantee a Bounce

https://youtu.be/S_aP3xjqcZM

RSI Below 30: Why Oversold Does Not Guarantee a Bounce #Shorts


RSI is below thirty. Does that guarantee a bounce? Watch the next red candle make another low while the oscillator stays depressed. Oversold can persist in a strong decline. A reclaim of a defined price level is different evidence from an oscillator merely entering a zone. Identify the level first, then watch the close.

HPT educational replay u...

RSI Below 30? Why Oversold Doesn’t Guarantee a Bounce

Touch or Acceptance? How to Read Price Closes

https://youtu.be/YWodN4_4lJk

Touch or Acceptance? Read the Close at the Level #Shorts


A brief wick through a level differs from sustained trading beyond it. Closes can add evidence, but a single close does not guarantee acceptance. Watch how later candles behave around the same reference.

Original Hollow Point Trading animation using an illustrative price sequence and HPT narration.

Free trading education: https://www.hollowpoi...

Touch or Acceptance? How to Read Price Closes

Swept High Rejected: Spotting a False Breakout

https://youtu.be/1GfLJ9UKb9E

Swept High Rejected: False Breakout or Another Test? #Shorts


Price can move above a prior high and then close back below it. That failed hold is evidence of rejection, but it does not guarantee a decline or prove stops were triggered. Watch the next response and define invalidation.

Original Hollow Point Trading animation using an illustrative price sequence and HPT narration.

Free trading education: ht...

Swept High Rejected: Spotting a False Breakout

Opening Price Trading: Reference Level or Pivot?

https://youtu.be/XHy7qRZ2hiE

The Opening Price: Reference Level or Magic Pivot? #Shorts


The opening price depends on the market, session and chart provider. Holding above or below it can help frame a session, but touching the open is not a trade by itself. Watch the return and the price response.

Original Hollow Point Trading animation using an illustrative price sequence and HPT narration.

Free trading education: https://www.hol...

Opening Price Trading: Reference Level or Pivot?

Round Numbers in Trading: Price Magnet or Barrier?

https://youtu.be/QN1_1ZAA3Q0

Round Numbers: Price Magnet or Guaranteed Barrier? #Shorts


Round numbers such as 50 or 100 can attract attention and orders. They are useful areas to observe, but they do not guarantee support or resistance. Watch the reaction and define where your idea fails.

Original Hollow Point Trading animation using an illustrative price sequence and HPT narration.

Free trading education: https://www.hollowpoint...

Round Numbers in Trading: Price Magnet or Barrier?

Deeper Pullback: Correction or Weakening Trend?

https://youtu.be/t79WgQol0w4

A Deeper Pullback: Normal Correction or Weakening Trend? #Shorts


Compare the current pullback with earlier corrections and the prior higher low. A deeper retracement can warn of changing trend strength, but one Fibonacci number cannot diagnose a reversal. Watch the next swing and reclaim response.

Original Hollow Point Trading animation using an illustrative price sequence and HPT narration.

Free trading ed...

Deeper Pullback: Correction or Weakening Trend?

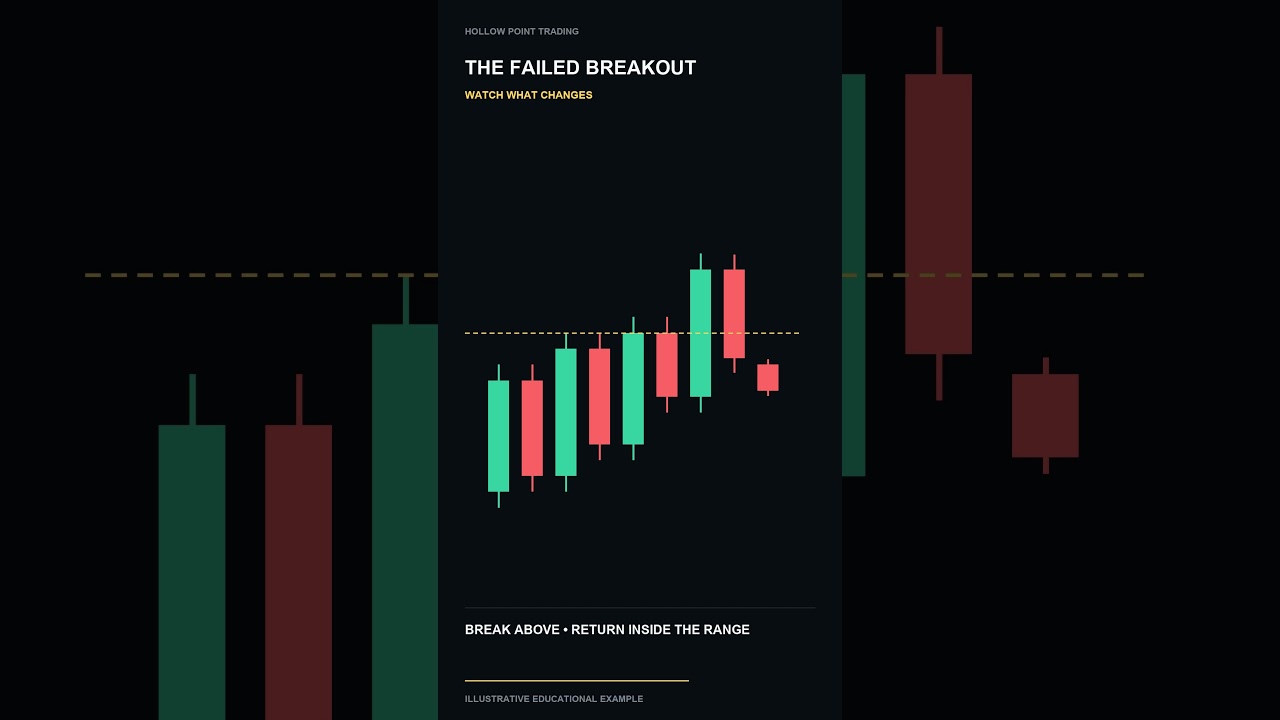
Failed Breakout: Spot the Close Back Inside the Range

https://youtu.be/_mNsMVk2KwA

Breakout Failed? Watch the Close Back Inside the Range #Shorts


Price can push above resistance and then return below it. A decisive close back inside the range is evidence of failed follow-through. Watch the next response; the chart does not reveal every trader’s position or guarantee a decline.

Original Hollow Point Trading animation using an illustrative price sequence and HPT narration.

Free trading ...

Failed Breakout: Spot the Close Back Inside the Range

Fresh Trading Levels: Untested Doesn’t Mean Support

https://youtu.be/-y40bWvczz4

Fresh Level: Untested Does Not Mean Guaranteed Support #Shorts


A fresh level has not been revisited since price moved away. That describes chart history; it does not prove hidden orders remain there. Watch the actual retest and price response before drawing conclusions.

Original Hollow Point Trading animation using an illustrative price sequence and HPT narration.

Free trading education: https://www.hollo...

Fresh Trading Levels: Untested Doesn’t Mean Support

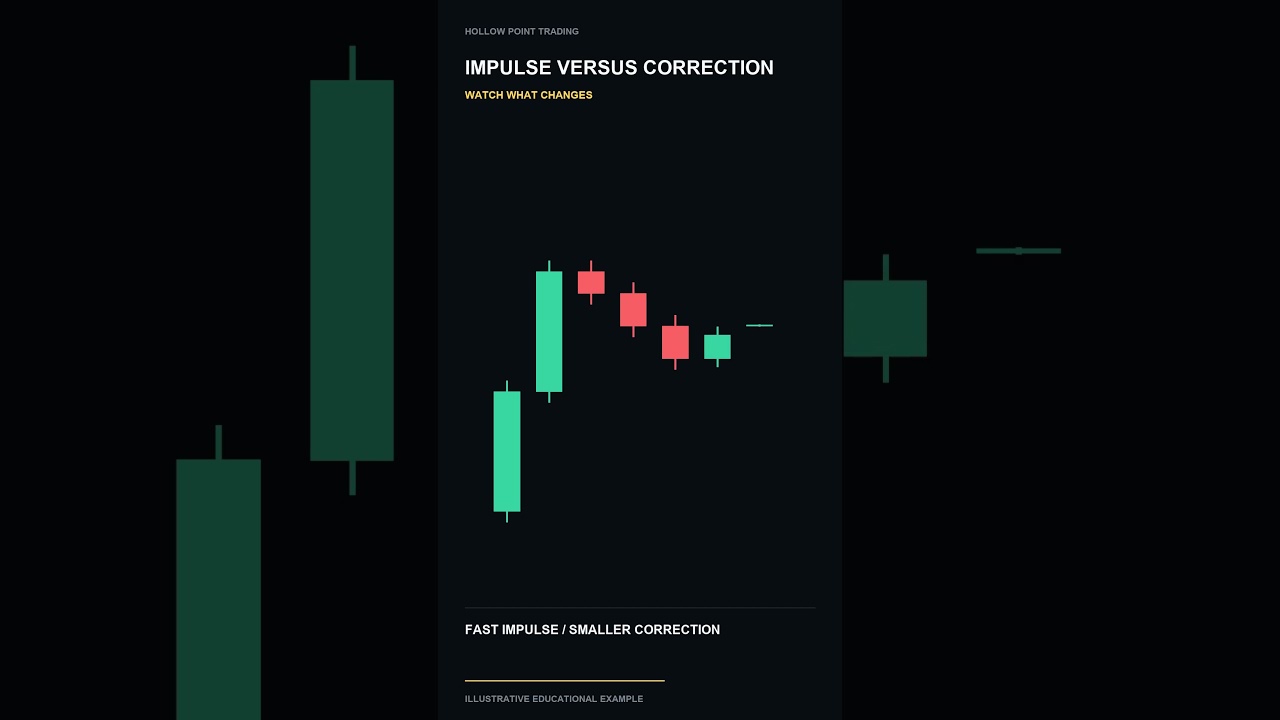
Impulse vs. Correction: Read Price Action Direction

https://youtu.be/8oBPTHElOXY

Impulse or Correction? Read the Direction and Overlap #Shorts


An impulse is typically directional and makes progress with the trend. A correction moves against it and can show more overlap. Compare both with the surrounding swings when assessing trend health.

Original Hollow Point Trading animation using an illustrative price sequence and HPT narration.

Free trading education: https://www.hollowpointtrad...

Impulse vs. Correction: Read Price Action Direction

Resistance Trading: Wick Rejection or Breakout?

https://youtu.be/F_0p6Onz0Ls

Resistance Is an Area: Does the Wick Show Rejection or a Break? #Sh...


Resistance marks an area where sellers previously responded. A wick through the zone followed by a return below it differs from sustained price above it. Compare the close and the next response instead of treating one line as exact.

Original Hollow Point Trading animation using an illustrative price sequence and HPT narration.

Free trading edu...

Resistance Trading: Wick Rejection or Breakout?