NDFI Explained: What QQQ Can Hide About Market Breadth
Summary
Hollow Point Trading shares an educational explanation of NDFI, which tracks the share of Nasdaq-100 stocks trading above their 50-day moving averages. The announcement shows how to check whether a QQQ rally has broadening participation or is driven by a narrow group of stocks.
https://youtu.be/qDD19XxH4ls
NDFI Explained | What QQQ Can Hide
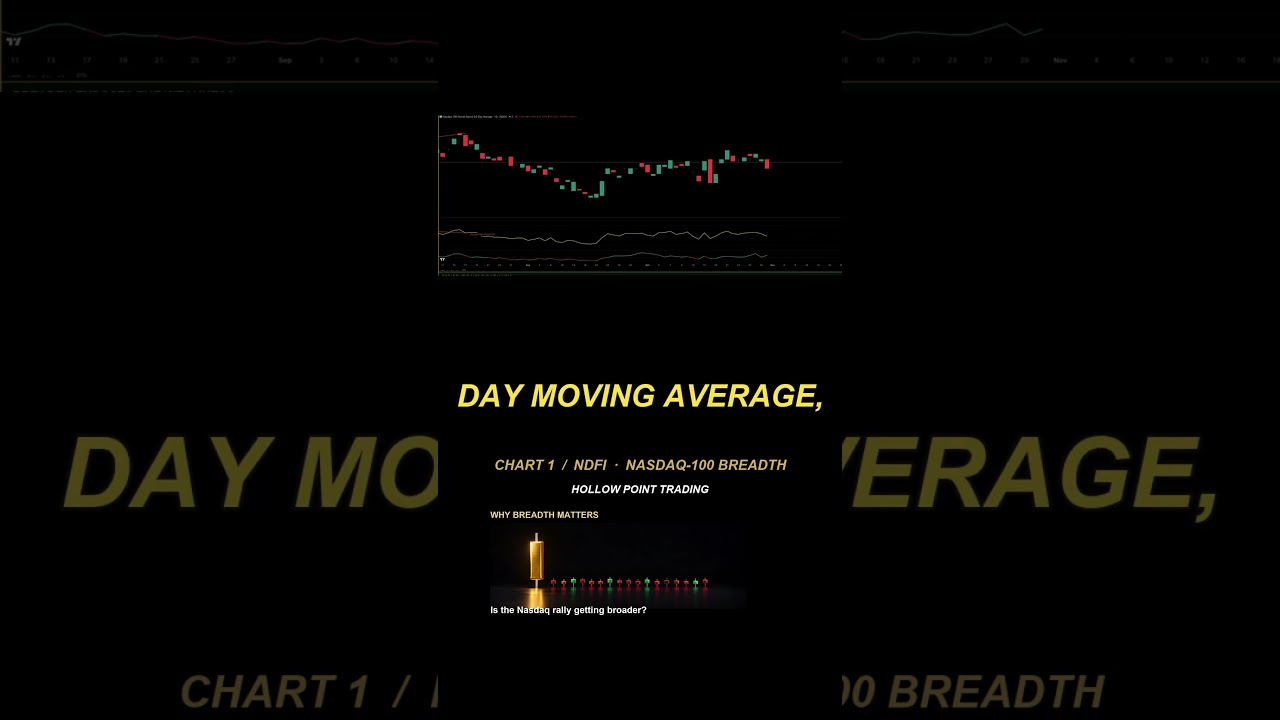
NDFI tracks the share of Nasdaq-100 stocks above their 50-day moving averages. When QQQ rallies, check whether participation is rising with it or whether the move is narrow.
Historical chart example. Candle graphic is illustrative. Educational only.