NVIDIA Bullish Engulfing: Bodies vs. Wicks
Summary
Hollow Point Trading shares a short lesson on identifying a bullish engulfing pattern in NVIDIA by comparing candle bodies rather than wicks. It details how the green candle’s 237.65–238.52 range covers the prior red body at 237.69–238.04, while emphasizing that pattern recognition is separate from trade planning.
https://youtu.be/ZXFEHufhhsM
NVIDIA bullish engulfing: bodies versus wicks #Shorts
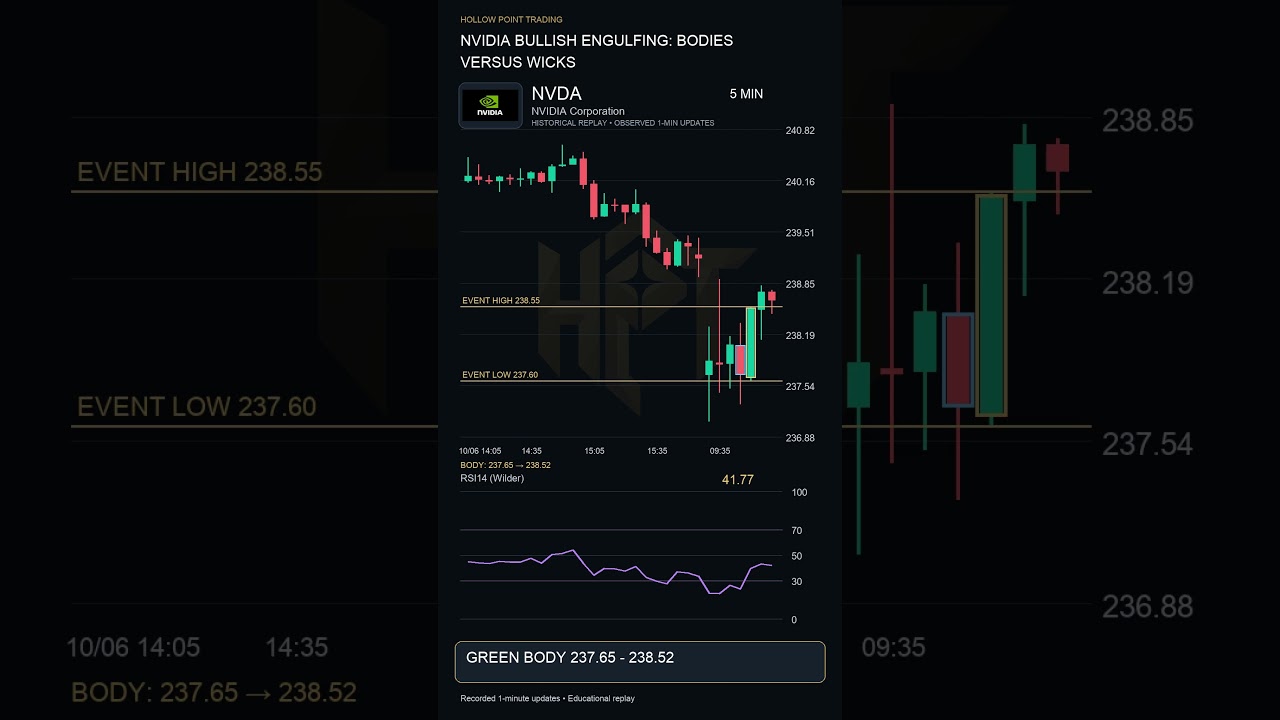
On NVIDIA, compare the two real bodies. The earlier red body spans 237.69 to 238.04. The next green candle opens at 237.65 and closes at 238.52, covering that body interval. This is bullish engulfing body geometry. It does not require taking out both prior wicks. Keep the definition separate from a trade: location, invalidation and the next comp...