Minecraft Dungeons 2 - Official The Humblers Awaken Announcement Trailer
The Sift is in danger! Something ancient is stirring beneath the ground of the new dimension – a threat that has slumbered for ages and is now beginning to wake. Gather your trusty allies, venture deep into unexplored reaches, take on the not-so-happy humblers, and confront the foes behind their rude awakening! The Humblers Awaken is coming December 1.
Powered by Readybot.io
DEV Community
Automated Verification Script for Redis Cache Jitter to Prevent Cache Stampede
Automated Verification Script for Redis Cache Jitter to Prevent Cache Stampede Background: Why We Needed a Simulator Initially, we started writing code with a casual mindset: "We can just add a random number within ±20% of the base TTL." However, during stress testing in our QA environment, two critical issues surfaced: Runaway Negative and Zero TTLs: When the random jitter width (jitter_range) exceeded the base TTL (base_ttl), the calculated TTL became 0 or negative, causing immediate key eviction or errors on the Redis side. Fragile JSON Parsing and Exception Handling: When invalid types or malformed payloads were fed into the system, Python's standard json module made it difficult to return structured, detailed validation errors, undermining its reliability as a CLI tool. We needed to stop implementing jitter based on "gut feeling" and establish a CLI tool in code that enforces strict input validation, guarantees safety in edge cases, and quantitatively verifies the distribution of generated TTLs. Architecture and Verification Flow This tool accepts JSON-formatted configuration values as input, passes them through strict type-safe validation via Pydantic, and calculates and aggregates jittered TTLs for the specified number of requests. sequenceDiagram
participant CLI as "External Process / CLI"
participant Core as "run_simulation()"
participant Validator as "Pydantic (SimulationConfig)"
participant Calc as "calculate_jittered_ttl()"
CLI->>Core: "JSON bytes (config_json)"
Core->>Validator: "orjson.loads() & Model Instantiation"
alt "Validation Error / Malformed JSON"
    Validator-->>Core: "ValidationError / JSONDecodeError"
    Core-->>CLI: "Error JSON (status: ERROR)"
else "Success Path"
    Validator-->>Core: "SimulationConfig Instance"
    loop "For each request (request_count)"
        Core->>Calc: "base_ttl, jitter_range"
        Calc-->>Core: "Jittered TTL (min 1s guaranteed)"
    end
    Core->>Core: "Distribution aggregation & stats (min, max, avg, unique)"
    Core-->>CLI: "Success JSON (SimulationResult)"
end Implementation The following code is a complete, standalone script that uses high-speed orjson for input serialization/deserialization and Pydantic v2 for data structure definition and validation. import random
import sys
from typing import List, Optional
import orjson
from pydantic import BaseModel, Field, field_validator, ValidationError
class SimulationConfig(BaseModel):
base_ttl: int = Field(..., gt=0, description="Base expiration time in seconds")
jitter_range: int = Field(..., ge=0, description="Maximum jitter range to apply in seconds")
request_count: int = Field(1000, gt=0, description="Number of requests for verification")
@field_validator("base_ttl")
@classmethod
def validate_base_ttl(cls, v: int) -> int:
    if v <= 0:
        raise ValueError("base_ttl must be greater than 0")
    return v
class SimulationResult(BaseModel):
min_ttl: int
max_ttl: int
average_ttl: float
unique_ttl_count: int
ttl_distribution: dict
status: str = "SUCCESS"
def calculate_jittered_ttl(base_ttl: int, jitter_range: int) -> int:
"""Applies random jitter to the base TTL."""
try:
if jitter_range == 0:
return base_ttl
jitter = random.randint(-jitter_range, jitter_range)
result = base_ttl + jitter
if result <= 0:
return 1 # Guarantee a minimum TTL of 1 second
return result
except Exception as e:
raise ValueError(f"Failed to calculate jittered TTL: {e}")
def run_simulation(config_json: bytes) -> bytes:
"""Executes the cache stampede verification simulation and returns results via orjson."""
try:
# Input validation using Pydantic
config_dict = orjson.loads(config_json)
config = SimulationConfig(config_dict)
except orjson.JSONDecodeError as jde:
error_res = ...
Powered by Readybot.io
DEV Community
How to Build Healthcare Appointment Retrieval Architecture — Failure Recovery
Short answer: make the retrieval contract explicit, keep durable policy in a vector index, use live web retrieval only for freshness, and degrade to a cited cached answer when a dependency times out. That boundary is what makes failure recovery testable for a healthcare appointment assistant. Start with the answer contract An appointment assistant should not begin with a vendor choice. Begin with the answer a patient can safely act on. For every response, define which facts must be current (clinic hours, appointment slots, holiday closures), which can be durable (approved preparation instructions), and what citation or document identifier the reviewer needs to see. I write that down as a small contract: freshness, authority, latency_budget, and evidence. A request for “Can I book Tuesday at 3?” needs live availability and a source URL or record ID. “How should I prepare?” can use an indexed clinical document, provided its revision is current and the assistant returns that document ID. If the contract cannot be met, the assistant should ask a narrower question or hand off; it should not fill the gap with a confident guess. This also gives the on-call engineer a useful failure signal. A timeout is not one generic error. It says which contract field was missed and whether a fallback is safe. For teams that want one plain HTTP surface around several backend capabilities, Infrai is a practical option to evaluate at this boundary: one key and one bill cover the retrieval calls, and the same REST convention can sit beside other services without an SDK install. Its public discovery endpoint exposes request schemas and runnable examples, so an adapter can follow declared paths instead of guessed REST shapes. I've found that boundary easier to review during an incident, though it still needs the same clinical governance as any other provider. How should a healthcare appointment assistant recover retrieval failures? Treat each source as a bounded step. Set an explicit timeout, cap the number of candidates, and retry only transient failures with exponential backoff. A slow web page must not hold the patient flow open while a worker waits forever. For live pages, retain the last verified snapshot with its retrieval timestamp; for durable records, keep the previous index generation until the replacement has been checked. The recovery order I use is deliberately boring: Try the source that satisfies the contract (vector or live web). On a timeout or rate limit, retry within the request budget. If freshness is still required, return a clear “needs confirmation” handoff rather than stale availability. If the contract permits a snapshot, answer from it and expose its URL or document ID. That distinction matters. A cached clinic policy is a reasonable fallback; a cached appointment slot is not. Your mileage may vary with the booking system's own consistency guarantees, so record that assumption in the runbook. The application should own the contract and policy. The retrieval provider should return passages plus provenance. This makes a provider swap a boundary change instead of a rewrite of booking logic. Here is a minimal Go adapter. It keeps the two paths separate so the caller can enforce the freshness contract and inspect source metadata. The payload fields shown are intentionally small; validate them against the live schema before production rollout. package main
Latchkey vs BuildJet is no longer a comparison you can act on: BuildJet announced the shutdown of BuildJet for GitHub Actions on 6 February 2026 and stopped running jobs on 31 March 2026. What is left is a migration, so this page is about the buildjet- labels still sitting in workflow files and what the surviving options cost against the rate you used to pay. The same month at each rate: 10,000 Linux minutes at 2 vCPU plus 2,000 macOS minutes, which BuildJet never sold either. Rates read 20 September 2026; the BuildJet bar is the rate its frozen page still shows. BuildJet sold managed runners on its own bare metal, adopted with a one-line runs-on change, at $0.004 a minute for 2 vCPU and 8 GB rising to $0.048 for 32 vCPU. It published arm64 variants of every size and a drop-in cache action with 20 GB per repository per week, which was double the GitHub-hosted allowance. Its site is still up and still shows that rate card, under a banner reading "BuildJet for GitHub Actions has been shut down", so do not price your migration from it. Latchkey sells managed runners the same way, at $0.0025 a minute for 2 vCPU and 8 GB, with a dependency cache that replaces buildjet/cache with a restore step and a save step, and transient failures repaired on the runner. It is the closest thing on price to what BuildJet was, and it is missing the thing a good share of BuildJet users were there for: there is no arm64, Windows or macOS runner, so an arm64 job has to land somewhere else. Every cell below was read from the vendor's own public pricing or documentation page on 20 September 2026. Where a vendor does not publish a number, the cell says "not published" instead of carrying a guess. Comparison BuildJet (ended 31 March 2026) GitHub-hosted Latchkey Price per minute, 2 vCPU Linux x64 $0.004 (2 vCPU, 8 GB RAM), on a frozen page $0.006 (2 vCPU, 8 GB RAM, 14 GB SSD on a private repo; free on public repos) $0.0025 (2 vCPU, 8 GB RAM, 100 GB disk) Price per minute, 4 vCPU Linux x64 $0.008 (4 vCPU, 16 GB RAM) $0.012 as a larger runner $0.005 (4 vCPU, 16 GB RAM, 100 GB disk) Free tier None published; concurrency subscriptions were made free on 6 February 2026 as the service wound down $12 of compute a month on Free, $18 on Pro and Team, $300 on Enterprise Cloud (2,000, 3,000 and 50,000 standard Linux minutes), private repos only 30-day trial, then 2,000 included minutes a month on Developer, 4,000 on Launch, 6,000 on Scale Billing granularity Per minute Every job is rounded up to the nearest whole minute Per minute Runner sizes and OS 2 to 32 vCPU on Ubuntu 22.04, x64 and arm64 Linux x64 and arm64, Windows x64 and arm64, macOS; larger runners to 96 vCPU 2, 4, 8 and 16 vCPU, Ubuntu 24.04 on x86_64 only. arm64, Windows and macOS are not offered Cache: type, limit, persistence BuildJet Cache, 20 GB per repo per week free, interoperable with actions/cache actions/cache, 10 GB per repository, entries removed after 7 days without access Size not published. latchkey-dev/cache-action@v1 replaces actions/cache with a restore step and a save step, keeping path and key (no restore-keys); entries are isolated per organization, versioned by OS, kept 14 days; a failed restore warns rather than failing the job Docker build acceleration BuildJet Cache in front of buildx; no managed layer-cache service after shutdown None built in. cache-to: type=gha writes into the same 10 GB store latchkey-dev/docker-cache-action@v1, layers held in a Latchkey-managed private registry per organization Concurrency limits Sold as a concurrency subscription, then made free during the wind-down 20 concurrent jobs on Free, 40 on Pro, 60 on Team, 500 on Enterprise Cloud. macOS is capped separately at 5, or 50 on Enterprise Developer 20, Launch 40, Scale 80 busy runners per workspace; idle warm runners do not count Where jobs run BuildJet's own bare metal, until 31 March 2026 GitHub's own hosted fleet Latchkey's own AWS estate on m6a-class hosts, one job per runner, no inbound access, ...
Powered by Readybot.io*
DEV Community
[Divulgação] Tech Briefing — Um boletim independente de vagas de tecnologia
Olá, pessoal! Gostaria de apresentar um projeto que comecei recentemente: o Tech Briefing, um boletim independente de divulgação de oportunidades de trabalho, inicialmente com foco no mercado de tecnologia. A ideia surgiu de uma situação bastante comum: encontrar uma vaga interessante nem sempre é tão simples quanto parece. Existem diversas plataformas, comunidades e canais de divulgação, mas as oportunidades acabam ficando espalhadas por diferentes lugares. Às vezes, uma boa vaga passa despercebida simplesmente porque não chegamos até ela. Foi pensando nisso que resolvi criar uma alternativa para reunir e compartilhar essas oportunidades. O que é o Tech Briefing? Imagine aqueles antigos classificados de jornal, nos quais as pessoas procuravam oportunidades de emprego. A proposta é trazer um pouco dessa ideia para o ambiente digital. O Tech Briefing funciona como um boletim de vagas, reunindo oportunidades encontradas em diferentes fontes e organizando suas principais informações para facilitar a consulta. Não somos responsáveis pelos processos seletivos e muito menos pelas contratações. Nosso papel é encontrar, organizar e divulgar oportunidades que já existem. Também temos uma preocupação importante com a qualidade das informações: não inventamos requisitos, salários, benefícios ou descrições. Procuramos preservar o máximo possível das informações disponibilizadas pela própria empresa ou pelo responsável pela divulgação da vaga. Onde você pode acompanhar? Atualmente, estamos trabalhando com três plataformas de divulgação e também compartilhando oportunidades em outras redes sociais. A ideia é justamente não limitar o projeto a um único canal. Se você prefere acompanhar as oportunidades pelo Telegram, Discord ou receber atualizações por e-mail, queremos explorar essas possibilidades. Não queremos que as pessoas precisem se adaptar ao projeto. Queremos que o projeto consiga alcançar as pessoas onde elas já estão. Inclusive, sugestões de novas plataformas, ferramentas e formas de distribuição são muito bem-vindas nos comentários. Empresas, projetos e comunidades também podem participar Outro ponto importante: o Tech Briefing não é exclusivo para grandes empresas. Se você é uma empresa, uma startup, um MEI, participa de um projeto independente ou conhece alguém que esteja procurando pessoas para trabalhar, pode entrar em contato para divulgar uma oportunidade. Aceitamos sugestões de vagas em diferentes modalidades, incluindo: Oportunidades CLT e PJ; Estágios e programas de trainee; Trabalhos freelancers; Projetos independentes; Oportunidades voluntárias; Outras modalidades de colaboração. Queremos facilitar a circulação dessas oportunidades, inclusive daquelas que normalmente não recebem tanta visibilidade. Se você encontrou uma vaga interessante e não sabe onde divulgá-la, pode entrar em contato comigo pelo LinkedIn ou por alguma das minhas redes sociais. Um projeto independente, em construção É importante deixar claro que o Tech Briefing é um projeto independente. Não recebemos financiamento de empresas, não cobramos para divulgar oportunidades e não temos vínculo comercial com as organizações responsáveis pelas vagas. Isso também significa que não garantimos a legitimidade de todos os processos seletivos. Procuramos verificar as informações disponíveis e evitar oportunidades suspeitas ou problemáticas, mas recomendamos que os candidatos sempre confiram os detalhes diretamente nos canais oficiais das empresas. Nosso objetivo inicial é publicar aproximadamente cinco oportunidades por dia. Ainda estamos longe dessa meta: atualmente, temos um volume bastante pequeno de divulgações. Mas todo projeto começa de algum lugar, e acredito que começar com uma oportunidade já é melhor do que não compartilhar nenhuma. O que vem pela frente? Apesar de o projeto ter começado com foco em tecnologia, não quero necessariamente limitar o Tech Briefing a esse mercado. Existem oportunidades interessantes em diversas áreas, e seria muito legal ...
Powered by Readybot.io
DEV Community
O mercado global de tecnologia está mudando: engenharia perde força enquanto Product Managers ganham espaço
Dados de 2026 revelam uma desaceleração nas oportunidades para engenheiros de software e um crescimento expressivo nas vagas de gerenciamento de produtos. O que está acontecendo com o mercado de trabalho em tecnologia? Durante anos, a engenharia de software foi uma das áreas mais promissoras do mercado profissional. A transformação digital, a expansão das startups, a computação em nuvem e a popularização dos aplicativos criaram uma demanda crescente por desenvolvedores. Entretanto, os indicadores mais recentes do mercado global de tecnologia apontam para uma mudança significativa nesse cenário. Segundo levantamento apresentado por Lenny Rachitsky em novembro de 2026, com dados da TrueUp e da Live Data Technologies, o crescimento das vagas abertas para profissionais de engenharia de software em empresas de tecnologia caiu drasticamente. Depois de crescer 29% em 2024 e 15% em 2025, o número de oportunidades avançou apenas 2,5% em 2026. Enquanto isso, as vagas para gerentes de produto (Product Managers) atingiram o maior patamar em quase quatro anos. Essa diferença merece atenção. Não estamos necessariamente diante do desaparecimento da engenharia de software, mas de uma possível transformação na maneira como as empresas organizam suas equipes, desenvolvem produtos e distribuem responsabilidades. 1. A desaceleração da engenharia de software Os números apresentados por Rachitsky mostram uma redução progressiva no ritmo de expansão das oportunidades profissionais. Ano Crescimento das vagas de engenharia 2024 +29% 2025 +15% 2026 +2,5% A desaceleração é expressiva. Em dois anos, o crescimento anual das vagas perdeu grande parte de sua força. O cenário fica ainda mais interessante quando observamos as contratações efetivamente realizadas nos Estados Unidos. Entre maio de 2025 e abril de 2026, aproximadamente 113 mil engenheiros de software foram contratados. Em 2022, durante o período de maior expansão do setor, esse número chegou a 239 mil. Isso significa que o volume recente representa menos da metade do pico registrado quatro anos antes. Outro indicador reforça a tendência: embora as oportunidades anunciadas para engenharia tenham crescido 44% desde janeiro de 2024, as contratações efetivas recuaram 17% no mesmo período. Essa diferença revela um problema importante para quem procura emprego: a existência de uma vaga não significa necessariamente que a empresa esteja conseguindo ou efetivamente realizando a contratação. Também pode indicar processos seletivos mais exigentes, mudanças nas prioridades corporativas ou maior cautela na expansão das equipes. 2. Product Managers: a outra face do mercado Enquanto a engenharia apresenta sinais de estabilização, o gerenciamento de produtos segue uma trajetória diferente. De acordo com o levantamento, as vagas abertas para Product Managers atingiram o maior nível em quase quatro anos, ficando 75% acima da mínima registrada em março de 2023. Desde o início de 2023, o crescimento acumulado das oportunidades foi: Product Management: +56%. Engenharia de software: +43%. A diferença pode parecer pequena à primeira vista, mas representa uma mudança relevante na distribuição das oportunidades dentro das empresas de tecnologia. Existe também outro dado interessante: entre as cinco categorias profissionais analisadas, Product Management foi a única cuja participação nas contratações aumentou, passando de 16% em 2021 para 21% em 2026. Entretanto, é necessário fazer uma distinção: o aumento das vagas anunciadas não significa que as contratações de Product Managers tenham crescido na mesma proporção. O próprio levantamento aponta estabilidade ou retração nas contratações de diversas funções de produto. A interpretação de Rachitsky é que encontrar profissionais de produto qualificados pode estar se tornando mais difícil. Isso levanta uma questão: por que empresas que estão desacelerando a contratação de engenheiros continuam demonstrando interesse em profissionais responsáveis pela estratégia e pela ge...
Powered by Readybot.io
DEV Community
Video to URL: drop an MP4, get a public link. No signup.
You're wrapping up a demo video, a screen recording, a clip an agent just rendered. Then the boring part starts: the tool you want to feed it to doesn't want a file. It wants a URL. Some social publishing tools work this way. So do a lot of APIs, automation platforms, and agents. They accept a video URL, not an upload dialog. So you end up pushing the file to some random host, waiting for a transcode you didn't ask for, and getting back a watch page instead of a link to the actual video. I got tired of that last mile, so I built the thing I wanted: Video to URL, a free tool that does exactly one job. Drop an MP4, get a public, seekable link. A few things it deliberately does NOT do: No signup. The anonymous link works the moment the upload finishes. No transcoding. The file is stored and served as-is, byte for byte. No recompression, no quality loss, no waiting for a "processing" spinner. No watch page. You get a direct CDN URL you can paste into an API call, an HTML tag, or any tool that takes a video URL. Standard players can seek through it, because the CDN answers HTTP range requests. The limits, up front: MP4 only, up to 25 MB on the anonymous tool, and anonymous links disappear within 24 hours. If you upload something and want to keep it, there's a "Keep this video" button right on the result: it saves that exact MP4 to a free account, no second upload. Bigger files (100 MB on Starter, 250 MB on Pro) and automated uploads go through the video upload API. That's the whole thing. A file goes in, a link comes out, and the person opening it never has to know PixelVault exists. If you try it and hit a wall, tell me in the comments - the tool exists because of walls I kept hitting myself.
Powered by Readybot.io
DEV Community
Debugging an MQTT Outage Across ESP32, Raspberry Pi, and Mosquitto Logs
The dashboard stopped updating. The ESP32 kept measuring temperatures. The Raspberry Pi was still running. So where did the readings go? I put together a small MQTT debugging scenario using four log files: ESP32 firmware log Raspberry Pi system journal Mosquitto broker log Dashboard application log The interesting part wasn't finding the disconnect message. It was reconstructing what happened before, during, and after the outage. By combining the logs into a single timeline, I could trace the broker shutdown, compare the clients' reconnection behavior, and identify four measurements that were taken but never published. I documented the investigation step by step, including screenshots and reusable highlighting tokens: I wish I’d had a tool like Emlyzer sooner. Here’s how I debug an MQTT outage with it. The temperature on my dashboard is stuck at 22.40 °C. The ESP32 is still taking readings. The Raspberry Pi is still on the network. And the dashboard has one clue: MQTT disconnected. That gives me a place to start. I want to know what broke first, what happened to the readings in between, and when the dashboard finally caught up. I start by following a single reading I open four logs in Emlyzer: the ESP32 firmware log, the Pi’s system journal, the Mosquitto log, and the dashboard log. To see how a temperature reading gets from the ESP32 to the dashboard, I select seq=1724. The sequence number ties the firmware and dashboard entries together, and the Mosquitto entries in between show the broker receiving and forwarding a message on the temperature topic. There’s also a lab-health entry from journal.log among the surrounding lines. The dashboard warning gives me my first highlight token, disconnected. It also picks out MQTT_EVENT_DISCONNECTED on the ESP32, 45 milliseconds after the dashboard warning. I look just before those two entries in the Pi’s journal. Mosquitto was already stopping. I add tokens for Stopping mosquitto.service and Started mosquitto.service to mark the interruption. A different color for New client connected makes it easy to spot when each client comes back. The broker comes back before the readings do In dashboard.log, I find the last reading before the gap, seq=1841. At 10:15:02.010, systemd begins shutting down Mosquitto, and the dashboard and ESP32 lose their connections. Once the broker is back up, the dashboard subscribes again and the sensor reconnects. The first reading to reach the dashboard after the gap is seq=1846. The Pi journal puts the client errors in order. The service was already stopping when the dashboard lost its connection, and both retry failures occurred before the service came back. The two clients then recovered on different schedules. The dashboard subscribed again almost two seconds before the sensor reconnected. The dashboard goes ten seconds between readings. Four measurements are missing. Where did they go? The firmware log shows that the ESP32 took readings 1842 through 1845 but skipped publishing them while its MQTT connection was unavailable. Then comes 1846. I add seq=1846 as a token and follow it from the firmware queue at 10:15:10.020 to the dashboard 35 milliseconds later. Mosquitto logs a publish arriving and being forwarded on the temperature topic in between. The sequence number ties the two ends together, and the broker’s topic and timestamps show the handoff. The service journal shows the stop and subsequent start. In this demo the restart is intentional. In a field capture I’d look for the trigger in operator, deployment, or audit records before attributing the restart to a person or a job. The next outage starts with a saved token set Before closing the logs, I save the tokens I built during the investigation as MQTT Connection Issue.etk. When the dashboard freezes again, I can open the new logs and load that file. The searches and colors are already there. I can go straight to the service events, see which client reconnected first, and check whether readings re...
Powered by Readybot.io
DEV Community
How I Made a Markov Chain Model from Scratch in C++ During a Global Online Teen Hackathon
Stardance, a global teen online hackathon hosted for teenagers by Hack Club, a nonprofit organization, had just recently ended. I had made many great projects, and I even got a 3D printer, completely for free, because of my work. I was locked and loaded to make another coding project, but I wasn't sure what program I should do it with. So, I stopped for a few days, and eventually found Pixl, something very like Stardance. In fact, they were so similar to each other that I was able to get right back into it and created Corpustein, a blazingly fast N-gram Markov Chain model with a configurable order and a rolling window system, in just 34 hours over 13 days. It is coded completely in the C++20 STL, and it provides an interactive and beautiful TUI just through a user-input loop and ANSI codes. If you are very confused as to what Corpustein is, it is a mini AI model that generates text token by token using a window of previous tokens (or words) and a container of all the possible n-grams (or groups of X tokens) based on the current window. This is what an N-gram Markov chain (plus a rolling window system) is. It also maintains a set of previously generated tokens to prevent repeating them, but allows common English words to be repeated. Corpustein is also the TUI that lets users interface with it. The thing that makes it different from what you probably think of when you hear "Artificial Intelligence" (most likely a Large Language Model) is that a Markov chain does not remember anything larger than its N-gram window, but an LLM has an attention model, which looks at a very long sequence of tokens to help generate responses. And, with LLMs, semantic similarity is automatically encoded as high-dimensional coordinates in a continuous vector space, while Markov Chains rely on matching exact word sequences. LLMs can also generate reasonable answers to questions they've never seen before because of how they learn more abstract rules, logic, and world knowledge. Whereas Markov Chains usually just repeat fragments of their training data. An LLM is also much slower than a Markov Chain and is way more resource-intensive. Think of Corpustein as a statistical or probabilistic model that generates mostly coherent English. In my previous project, MDEZ++, I didn't think I got enough experience with actual C++, without the Qt Framework simplifying everything for me. If you want to read the article about it, look here. I definitely can not say the same thing here. I think this was the best thing I've ever done for my low-level coding skills, ever. Check out the GitHub repository here. If you are a Hack Club member, you can access the project page here. If you want a quick download, check this table! Linux Windows macOS Linux Executable tar.gz (x86_64) Windows Executable ZIP (x86_64) Not Automatically Compiled by CI/CD Features Fast and Lightweight: Built only on the C++20 STL, Corpustein is fast and consumes virtually no resources. Custom Corpus Loading: Users can load custom corpus files to be used by Corpustein. Additionally, Corpustein comes with a vast array of default options already baked into the program for them to load. Automatic Configuration: Corpus files contain metadata that provides default settings for the model to use, determined by the content of the corpus by its creator. If the file appears to just be a normal text file without any sort of metadata, it will skip the default settings gracefully. Compatibility: With portable, native binaries automatically generated by the CI/CD for both Linux and Windows, Corpustein can be used on just about any system. Commands and Settings: Corpustein contains various commands users can run while in the interactive terminal environment to control many things about the model, like the order, maximum sentence count, and much more. Alternate Terminal Buffer: Corpustein uses an alternate terminal buffer to make a beautiful, stylized environment. Users are able to enable and disable this alternat...
Powered by Readybot.io
DEV Community
Yeezy 350 V2 resale in 2026: small sizes sell under retail, big sizes don't
Yeezy 350 V2 talk in 2026 usually says "they all sit under retail now". On GOAT that is only true for some sizes. A typical colorway costs about 37% less than retail in a size 4.5 and 40% more than retail in a size 12. I pulled per-size prices for 25 Yeezy Boost 350 V2 colorways from GOAT (US market, new in box) on November 15, 2026. That gave 585 size-level prices for sizes in stock. Here is what they show. 1. Every colorway has a size under retail, but the typical size is not All 25 colorways had at least one size with a lowest ask below the retail price. That is where the "Yeezys are dead" headline comes from: the product page shows the cheapest size. The middle-priced size tells a different story. For the typical colorway, the median size costs 32% more than retail. Only 8 of 25 colorways have their median size under retail: Colorway Retail Median size ask vs retail 'Carbon Beluga' $230 $196 -15% 'Salt' $230 $206 -10% 'Steel Grey' $230 $210 -9% 'Bone' $220 $204 -7% 'MX Rock' $230 $218 -5% The older, proven pairs still hold a real premium in a normal size: Colorway Retail Median size ask vs retail 'Beluga 2.0' $220 $525 +138% 'Black Reflective' $250 $535 +114% 'Oreo' $220 $405 +84% 'Bred' $220 $378 +72% 'Beluga' $220 $370 +68% 2. Small sizes are the cheap ones I compared each size's lowest ask to the shoe's retail price, then took the middle value across all 25 colorways. US men's size Median vs retail Colorways under retail in this size 4 -46% 21 of 25 4.5 -37% 20 of 24 5 -34% 22 of 25 5.5 -29% 20 of 25 6 -24% 18 of 25 6.5 to 7.5 -8% to +3% about half 8 to 10 +7% to +30% 8 to 12 of 25 10.5 to 12 +28% to +40% 2 to 4 of 25 12.5 to 15 +51% to +82% 0 to 3 This is the opposite of the Air Jordan 4, where I found the small sizes carry the biggest premium. A likely reason: the 350 V2 was restocked in big runs across the full size range, and the small sizes have the fewest buyers. If you wear a 4 to 6 (or buy for a teenager), the 350 is cheap in 2026. If you wear an 11 or bigger, you still pay well above the store price. Overall, 211 of the 585 size prices (36%) were below retail. 3. Asks sit right on the last sale Across sizes with both numbers, the median gap between the current lowest ask and the last sold price was 0.3%. 293 asks were above the last sale and 284 were at or below it. For in-stock sizes, the lowest ask is a fair guide to what the pair trades at. The extreme asks ($2,000+ on a size 3.5 or 15.5) are single sellers with no competition, not a market price. How to pull this yourself GOAT has no public price API and blocks plain requests. I built a tool on Apify that returns this data as a table: GOAT Sneaker Price Scraper. Input used for this article: {
"queries": ["yeezy boost 350 v2"],
"maxProductsPerInput": 25,
"includeSizePrices": true
}
Each product row has the retail price, release date, lowest ask, cheapest and most expensive size, premium vs retail, and a list of every size with its lowest ask, instant-ship ask, last sold price, and stock. Export to CSV, Excel, or JSON. This 25-product run with all sizes took 41 seconds. Cleaning I did: kept only sizes marked in stock with an ask, compared each size to its own colorway's retail price, and used medians so a single $2,000 listing does not move the result. Limits to know about Prices are US market, in US dollars. GOAT shows different prices to visitors from other countries. "New" means new shoes in a good box. Used pairs are a separate option. This is a one-day snapshot of the 25 colorways GOAT returned first for that search, not every 350 V2 ever made. Sizes 16 and 17 (+57% and +85%) are left out of the table to keep it short; sizes 3, 3.5 and 15.5 had only one to three colorways in stock. If a number looks wrong for a pair you know well, tell me and I will check it.
Powered by Readybot.io
DEV Community
Building a Manifest V3 extension that only acts after you say yes: a dashboard bridge, a log ring buffer and an approval queue
EvenLeads is a web app plus a Chrome extension. The web app finds public "looking to hire" posts and writes a draft reply. The extension posts that reply from the user's own account once they approve it, or on its own if they switch Auto-send on. Wiring the two together in Manifest V3 taught me a few things. 1. A content-script bridge between the dashboard and the extension The dashboard is an ordinary web page, so it can't call extension APIs. A small content script runs only on our own domain and relays messages: the page dispatches a CustomEvent with a request type and payload the content script picks it up and forwards it with chrome.runtime.sendMessage the background service worker handles it and answers the content script fires a response CustomEvent back to the page Every request type has a matching response type, so the page can time out cleanly when the extension isn't installed or was just reloaded. The whole thing is deliberately dull and easy to test. 2. Service workers die, so expect "Extension context invalidated" MV3 stops the background worker and starts it again whenever Chrome decides to. Anything held in memory disappears, and a page still talking to the old instance gets "Extension context invalidated". What helped: state lives in chrome.storage, never in module variables every message is handled as if it could be the first one after a restart the page detects an invalidated context and asks for a refresh instead of failing silently 3. Keep your own service worker logs You can't open DevTools on a user's service worker. The background script wraps console.log, warn and error and keeps the last 500 entries in a ring buffer. A test command over the same bridge returns that buffer, so when a send fails during testing I can read what the worker did without going near chrome://extensions. 4. The web app decides and the extension executes The extension never chooses what to send. It receives one task at a time, holds an in-flight lock so the same lead can't be sent twice, runs it and reports the result to the dashboard. Keeping decisions on the server keeps the extension small and much easier to reason about. 5. Intents instead of selectors LinkedIn, Reddit and Facebook change their markup often. Hard-coded selectors for the comment box or the send button would break constantly, so the extension uses a small declarative intent engine: open the composer, type, submit, verify. Each intent tries known selectors first and falls back to role and visible text. 6. Default to slow The extension could reply seconds after a post appears. By default it waits for a person. Instant replies to every matching post look automated however good the text is, and many communities don't allow vendor replies at all. Approval is the default and Auto-send is a switch the user turns on. Disclosure: an AI agent wrote this post from the EvenLeads code and posted it for me. I read and approved the text before it went up.
Powered by Readybot.io
DEV Community
Ticketing feeds lie a little: cleaning concert listings from six partner APIs
events.lat is a calendar of concerts, festivals and cultural events in Latin America: more than 3,000 upcoming events in over 100 cities, in English, Spanish and Portuguese. Almost none of it is typed in by hand. It comes from partner feeds: Ticketmaster, Eventbrite, Sympla, Bandsintown, Songkick and Luma. Each feed is fine for what it was built for: selling tickets. Put them all on one browse page, though, and you see things that make no sense to someone looking for something to do on Saturday. Here are the three problems we hit, and the small, boring functions that fixed them. 1. Add-ons that look like events Partners publish ticket upsells as their own events. A "Hi-Touch" photo session sold with the note boleto de evento no incluido (event ticket not included). A pre-signed poster. A parking pass for a festival. In the feed they have a title, a date and a venue, just like the concert. The fix is a pattern on the title: const ADDON_PATTERN =
/(boleto de evento no in?cluido|no incluye boleto|entrada no incluida|ticket not included|hi[\s-]?(touch|bye)|pre[\s-]?signed|meet ?& ?greet|soundcheck|^\sestacionamiento\b|\b(estacionamiento|parking)\s$|\bupgrade\b)/i;
const isTicketAddon = (e: { title?: string | null }) =>
ADDON_PATTERN.test(String(e.title ?? ""));
The hard part is what to leave out. An Abono … is a season or multi-day pass, and a Grada 15, Formula 1 … is a grandstand tier. Both look like add-ons, but they are real tickets to a real event, so filtering them would hide things a visitor can actually buy. Parking had a bug of its own. The first version matched the word at the start of a title, and that hid an event called "Parking Lot Party". Now English "parking" only counts as the last word ("Festival Vaivén 2026 Estacionamiento" is a car park; "Parking Lot Party" is a party). Spanish estacionamiento is safe at either end. Each of those cases is now a test. 2. One show, ten listings A theatre run comes in once per performance. El Fantasma de la Ópera playing ten nights at one theatre filled ten slots on the page, and pushed everything else off it. So we group performances into one production with a key built from the title and the venue: const fold = (v: unknown) =>
String(v ?? "").toLowerCase().normalize("NFD").replace(/[\u0300-\u036f]/g, "");
function productionKey(e: { title?: string | null; venue?: string | null; city?: string | null }) {
const title = fold(e.title)
.replace(/\b(19|20)\d{2}\b/g, "") // "… 2026" on some nights, not others
.replace(/[^a-z0-9]+/g, " ")
.trim();
return ${title}::${fold(e.venue ?? e.city).trim()};
}
Accents, case, punctuation and the year all go, because partner titles for the same run vary from night to night, for example "Ópera" on one and "Opera" on another, with or without "2026". The venue stays in the key, so the same touring show in two cities is still two listings. Then we keep only the soonest performance of each production, in the order the rows came in: type Listing = { title?: string | null; venue?: string | null; city?: string | null; event_date?: string | null };
function dedupeListing(events: T[] | null | undefined): T[] {
const seen = new Set();
const out: T[] = [];
for (const e of events ?? []) {
if (isTicketAddon(e) || isImplausibleEvent(e)) continue;
const key = productionKey(e);
if (seen.has(key)) continue;
seen.add(key);
out.push(e);
}
return out;
}
One rule we hold to: these helpers only remove noise. They never reorder by "quality", because someone looking for a specific date has to find that date where they expect it. The list stays in date order. Since the list can shrink, callers ask for a few extra rows. 3. Rows that can't be real Some feeds leave out the location and the importer fills in a placeholder. We found an event in a city called "Nocity", dated 31 December 2039. const PLACEHOLDER_CITIES = new Set(["nocity", "no city", "n/a", "na", "unknown", "tba", "tbd", "-"...
Powered by Readybot.io
DEV Community
Spec first, then let it haunt you: building Deadline Séance with Kiro
This post is written as part of the Kiroween 2026 hackathon. The meeting nobody wants Every release ends the same way. Monday morning, the freeze is Friday at six, and the board holds far more work than the team can do. Someone has to decide what gets cut, and it is usually the loudest voice in the room. Deadline Séance turns that meeting into a rule you can see. Tickets that fit stay inside the safehouse; the rest are buried under tombstones with an epitaph that says why ("It needed 8 points; the night had 0 left"). Burn the candle down from Friday to Wednesday and capacity drops from 59 to 35 points. Send Ana away and the cut updates at once. Every decision goes into a chronicle you can undo. Try it (no sign-in, nothing leaves your browser): https://hvaler.github.io/deadline-seance/ Writing the rule before the code The first thing I put into Kiro's steering was not a style guide. It was the rule in plain words: keep must-haves, keep a ticket's whole dependency chain, fit the capacity, maximise the cost of delay you save, and break ties in a fixed order. Every spec started from that sentence, so "best cut" meant the same thing in the engine, the UI, the death certificate and the MCP server. I used eight specs: rule-engine, board-ui, fog, night-tour, death-certificate, jira-csv, mcp-server and night-chronicle. Each one stopped twice: after requirements and design, so I could argue with the decisions, and at a checkpoint with real numbers before I committed. For small polish I used vibe mode in a fresh chat. My rule of thumb became: spec when a property must hold, vibe when only a pixel moves. The test that changed the product The fog of estimates simulates 1,000 nights where every estimate lands between 80 % and 150 % of what was written. On the sample board the optimal cut holds on 0 of 1,000 nights; with a 20 % reserve, on 707. I assumed more reserve is always safer. A property-based search with fast-check found a small board where it is not: a bigger reserve changes which tickets the rule keeps, and the new set can be riskier. That one finding changed the UI. The strip now shows the number for every reserve instead of promising that more margin helps. There are 27 numbered properties and 1,532 tests in the repo, and a Kiro hook runs them every time an engine file is saved. Giving the rule back to Kiro The same engine ships as an MCP server with three read-only tools: solve_freeze, what_if and death_certificate. Registered in .kiro/settings/mcp.json, it turned Kiro's agent into a user of the product it built. Asked what happens if Ana is away all week, it answered with the engine's numbers: capacity 59 → 39, nine tickets kept, cost of delay 167 → 124. No number came from the model. Kiro Crew and a real Jira I also tried Kiro Crew. First as a second reviewer of my last four commits (it found a guard that was created but never called), then to build a separate app, Deadline Séance Crew, that reads live Jira Cloud issues and asks the same engine. Crew deliberately keeps Jira credentials away from the processes it starts, so the Jira reader runs outside Crew, only on 127.0.0.1, and Crew reaches it by URL. Seeded with the sample board, the real Jira gave exactly the same cut. https://github.com/hvaler/deadline-seance-crew What went wrong Three deploys failed in a row because two CSV test fixtures kept Windows line endings only on my machine. The tests stopped a broken build; a .gitattributes fixed it at the root. Jira's issue-link API names its two ends the opposite way to what you expect. The seed script read back its first "Blocks" link, found it reversed and stopped before creating the rest. A test now pins the direction. What I learned Spec mode is worth it whenever two features share state. A steering file that states the rule in plain words beats a long list of style rules. And property tests are where an assumption like "more margin is always safer" goes to die. Demo video: https://youtu.be/Vn5QPBWRCSQ Code (MIT): http...
Powered by Readybot.io
DEV Community
Object Storage Service Versus Authenticated Proxy for 3 App Data Backup Boundaries
Short answer: for an app choosing an object storage service for data backup, use direct object delivery when expiry is an acceptable revocation model; choose an authenticated proxy when every download needs a current authorization decision. A media application serving generated reports to authenticated customers has two different problems: keeping backup objects through their retention window, and deciding who may retrieve a report today. I would choose signed object delivery when the object store can enforce the required lifetime and the customer can fetch directly. I would choose an authenticated proxy when every download needs a server-side authorization decision, redaction, or audit record. The storage service is a secondary decision. The useful test is not which option has the nicest upload API. It is whether a leaked download link is an acceptable failure. I initially treated backup storage and customer delivery as one design choice. That made the retention rule carry too much responsibility. For app-data backups, I split the design into three boundaries: operational recovery, customer delivery, and deletion. That separation keeps lifecycle automation from quietly becoming an access-control policy. Which object storage service should handle app data backup? For generated media reports, a backup object may contain a customer identifier, a time range, and derived metrics. A customer session proves identity to the application; it does not automatically make an object URL safe to share. A signed delivery link moves the final byte transfer away from the application, which is attractive for large files and bursty demand. Its weakness is also clear: possession of the link is usually the practical bearer credential until it expires or is revoked by the surrounding design. An authenticated proxy keeps the authorization check in the application path. The proxy can verify the session, check tenant ownership, record the report identifier, and stream only after those checks pass. This gives a narrower control point, but it makes bandwidth, timeout handling, and range requests part of the application’s operational surface. A proxy is not automatically safer; it is safer only when its checks are complete and its logs do not leak the same object credential. That is the first boundary. Backup retention should not decide customer authorization. Which boundary changes the choice? Boundary Signed object delivery Authenticated proxy Large report transfer Fewer application bytes and less connection work More control, more application capacity required Per-request authorization Usually expressed before issuing the link Evaluated on every request Immediate revocation Needs a short expiry or an external deny list Natural fit for session and tenant checks Audit detail Must be captured when issuing and using the link Can be captured at the download boundary Browser integration Direct download can require CORS and careful URL handling Same-origin delivery can simplify browser policy The table is a trade-off map, not a ranking. If a customer can download a report for 15 minutes after an administrator removes access, a signed link may fail the product requirement. If a report is 2 GB and customers download it in parallel, forcing every byte through a Python process may fail a capacity requirement. Measure those constraints before copying the pattern. How do lifecycle rules interact with recovery? Lifecycle automation is a retention mechanism, not a backup strategy. A rule that expires old objects can be correct for temporary exports and disastrous for the only recoverable copy of application data. The retention clock also needs an explicit event: object creation, backup completion, or a verified copy into another recovery boundary. “Older than 30 days” is meaningless until the team agrees what age represents. I use separate prefixes or metadata for backup classes, then test each class with a restore job. The exact mechanism varies by storage serv...
Powered by Readybot.io
DEV Community
Why Architecture Matters More Than Syntax in 2026
Introduction: The Shift from Code to Design For over a decade, I've been practicing Laravel's MVC (Model-View-Controller) and Repository patterns. These taught me valuable lessons about separation of concerns, data abstraction, and clean code composition. They gave us the foundation for reliable enterprise applications. But times have changed. As AI agents increasingly take over mundane coding tasks—from writing boilerplate to generating test cases—the dynamic between developer and machine has fundamentally shifted. We now live in an era where the minutiae matter more than ever. AI can write the syntax; it cannot reliably understand context across complex systems, navigate structural dependencies, or maintain architectural intent when pushed too far. Where once we were constrained by our own ability to structure code, agents today are constrained by how well they understand your application's architecture. The question that now arises isn't "how do I write better syntax?"—it's "how do I create architectures resilient enough to contain and guide both human developers and AI agents alike?" This is why, in my recent work, I've been transitioning away from traditional MVC patterns toward CLEAN architecture, with its data abstraction layer deliberately positioned away from business logic. While this may sound like architectural purism for its own sake, the practical results speak for themselves: sharper structure, informed agents, faster feature development, and a clearer mental model for both myself and my collaborators—human or otherwise. The Problem: AI Agents Are Better at Syntax Than Design Modern AI coding assistants are remarkably proficient at syntax generation. They can produce perfectly formatted functions, write comprehensive unit tests, and generate documentation that reads like it came from someone with deep expertise. But this proficiency often comes at the cost of structural coherence. Consider this common scenario: an AI agent generates code for a new feature based on natural language instructions or incomplete requirements. It writes the controller logic correctly but forgets to update data access patterns It creates services that mirror the structure of unrelated systems in the same project It uses over-engineered abstractions where simple composition would suffice It makes "fixes" that actually introduce hidden dependencies or violate existing architectural principles The result? Code that runs, tests pass, but doesn't compose well with other changes. When another feature needs to be added later, the structural debt compounds. Agents are exceptionally good at their task within a narrow context window—they're bad at understanding how that context fits into a larger system's architecture. CLEAN Architecture: Keeping the Data Abstraction Separate CLEAN architecture—also known as "Onion Architecture"—positions the domain (business logic) at the center, surrounded by layers of abstraction that provide services and interfaces without containing business rules themselves. The Layer Structure ┌─────────────────────────────────────────┐
│ VIEW LAYER │ ← Presentation/UI
│ Controllers, Renderers, UI Components │ AI agents work with least precision here
├─────────────────────────────────────────┤
│ APPLICATION LAYER │ ← Use cases/Orchestrators
│ Facades, Service Composition │ Agents can approximate intent
├─────────────────────────────────────────┤
│ DOMAIN (BUSINESS) LAYER │ ← Core rules, invariants
│ Value Objects, Entities, Services │ Most constrained layer
├─────────────────────────────────────────┤
│ DATA ABSTRACTION LAYER │ ← Repositories, Interfaces
│ DAOs, DTOs, Mappers │ Agents write implementations against contracts
└─────────────────────────────────────────┘
The Key Difference: Separating View from Domain In traditional MVC patterns, the data abstraction layer sits...
Powered by Readybot.io
DEV Community
Keeping link blocks stable across platforms #8oan8
Related-link blocks should be generated once and appended after the article body; platforms differ in markdown and HTML support. Related Source repository Mbin instance Author profile on DEV
Powered by Readybot.io
DEV Community
Circuit Breakers in Production: Timeouts, Retry Storms, and Failure Recovery
A dependency doesn't have to go completely offline to cause trouble. Sometimes it just gets slow enough that requests pile up, workers stay busy, and retries add even more traffic to a service already struggling. A circuit breaker gives that dependency breathing room—but only if the timeouts and retries around it are configured with the same care. The Problem Working with multiple LLM providers (OpenAI, Anthropic, Google) presents several challenges. Each provider has different failure modes, rate limits, and latency characteristics. Without proper handling, a slow or failing provider can bring down an entire pipeline. The naive approach is to add timeouts and retries. But this creates new problems: Retries during an outage amplify the problem (retry storms) Long timeouts block resources and cascade failures Users wait for failures we already know will happen What is a Circuit Breaker? The circuit breaker pattern, popularized by Michael Nygard in "Release It!", works like an electrical circuit breaker. When failures exceed a threshold, the circuit "opens" and immediately fails requests without attempting them. Three states: Closed - Normal operation. Requests pass through. Open - Failure threshold exceeded. Requests fail immediately. Half-Open - Testing if the service recovered. Let a single probe request through. The half-open state is where most implementations go wrong. If the dependency is just coming back, the worst thing you can do is send it the full load again. One probe is enough to learn whether it recovered. Implementation Here's a simplified circuit breaker. It is per-process: the lock protects threads in one process, and nothing here coordinates between processes (more on that below). import time
from datetime import timedelta
from enum import Enum
from threading import Lock
class CircuitState(Enum):
CLOSED = "closed"
OPEN = "open"
HALF_OPEN = "half_open"
    self.state = CircuitState.CLOSED
    self.failure_count = 0
    self.opened_at = 0.0
    self.probe_deadline = 0.0   # when the current probe's claim expires
    self.lock = Lock()

def can_execute(self) -> bool:
    with self.lock:
        now = time.monotonic()

        if self.state == CircuitState.CLOSED:
            return True

        if self.state == CircuitState.OPEN:
            if now - self.opened_at < self.recovery_timeout.total_seconds():
                return False
            # Timeout over: this caller claims the probe.
            self.state = CircuitState.HALF_OPEN
            self.probe_deadline = now + self.probe_lease.total_seconds()
            return True

        # Half-open: one probe is already out. Everyone else fails fast,
        # unless the probe's lease expired (the prober never reported back).
        if now >= self.probe_deadline:
            self.probe_deadline = now + self.probe_lease.total_seconds()
            return True
        return False

def record_success(self):
    with self.lock:
        if self.state == CircuitState.HALF_OPEN:
            self.state = CircuitState.CLOSED
        self.failure_count = 0

def record_failure(self):
    with self.lock:
        if self.state == CircuitState.OPEN:
            return   # a late result from a call that started before we opened

        if self.state == CircuitState.HALF_OPEN:
            self._open()   # the probe failed: back to open, restart the timer
            return

        self.failure_count += 1
        if self.failure_count >= self.failure_threshold...
Powered by Readybot.io
DEV Community
The Complete Web Attack-Surface Checklist, Built on Seven Boundaries
Security looks like a thousand unrelated bugs. SQL injection, broken access control, use after free, server-side request forgery, a subdomain takeover, an integer overflow in a codec. A beginner tries to memorize them one at a time and drowns. The list never ends, and every new framework invents ten more names for the same thing. They are not a thousand things. They are one thing, seen from seven angles. Every vulnerability is the same move. An attacker crossed a trust boundary that was supposed to hold. The system assumed something would stay on one side of a line, and it did not. Classify by which line broke, and the thousand names collapse into seven boundaries. The first half of this piece is the model. The second half is the complete checklist that falls out of it, so you can run the whole surface without skipping anything. The one sentence A vulnerability is a crossed trust boundary. That is the whole field in six words. Everything else is which boundary, at which layer, in how many steps. The names on the thousand-item list describe the technique. The boundary describes the reason the technique works. Technique changes every year. The boundaries have not changed in decades, because they come from how systems are built, not from what tool is in fashion. The seven boundaries 1. Identity. The system has to answer "who are you," and it answers wrong. An attacker forges or bypasses the proof. The question: can the proof of identity be forged or skipped? 2. Authorization. Identity is real this time, but the user reaches past what they are allowed to touch. The question: with a valid account, can I reach another account's data or another tenant's world? 3. Data versus code. Input that was supposed to be data gets executed as code. The injection family. The question: can my input stop being a value and start being an instruction? 4. The confused deputy. A trusted intermediary is tricked into acting for the attacker. The essence is not injecting code, it is borrowing a hand the system already trusts. The question: can I make a trusted party act on my behalf? 5. Business logic. Every technical check passes and the rules still have a gap. The question: does the business rule have a case nobody wrote down? 6. Configuration. Someone left a door open. A dangling DNS record, a key in a public repo, an internal dashboard exposed. The question: is there a door left open that was supposed to be shut? 7. Memory. The program writes outside the bounds or the lifetime it intended, and the machine keeps running on corrupted state. The question: can I write outside the lines the program drew? Whatever bug you are staring at, it is a crossing of one of these, or a chain of several. Three distinctions people get wrong Authentication is not authorization. Authentication is who you are. Authorization is what you can do. Most of the money lives in authorization, especially object-level access control and multi-tenant isolation, because crossing from one user or one company to another is direct harm. The confused deputy is its own class. Do not fold server-side request forgery into injection. Injection makes the target run your code. A confused deputy makes a trusted party run your errand with its own authority. On the web, the server's network position is worth far more than its CPU. One bug can span two boundaries. Cross-site scripting is both injection and confused deputy, which is why it is so often the first link in a chain. The layer decides the weapon The boundary tells you the kind of bug. The stack layer tells you which boundaries are even on the table. Memory corruption, boundary seven, only exists where code touches raw memory. That is the C, C++ and assembly world of firmware and native applications. In the managed world of Python, JavaScript, Go and Java, boundary seven is absent. The runtime checks the bounds and manages the lifetimes, so those systems break on boundaries one through six instead. So there are two battlefields and t...
Powered by Readybot.io
DEV Community
What Apple did not disclose about CVE-2026-112616
What Apple did not disclose about CVE-2026-112616 The public record for CVE-2026-112616 is brief. Apple identifies a Screen Time authorization issue, says an app may access sensitive user data and states that improved access control fixed it. The affected releases include iOS 27.2, iPadOS 27.2, macOS Golden Gate 27.2 and visionOS 27.2. Security writing often turns an advisory into a complete attack narrative. This CVE does not provide enough information for that. The gap is not a reason to ignore the update, but it does change what defenders can claim. What is established The source advisory lists the affected product family and fixed versions. Apple's iOS and iPadOS security note places CVE-2026-112616 under Screen Time and says an app may access sensitive user data. The GitHub Advisory Database classifies it as CWE-862 and gives CVSS 3.1 a score of 5.5. The CVSS vector is local, low privileges, no user interaction, unchanged scope and high confidentiality impact. Integrity and availability are none. This is a consistent account of a local privacy-boundary failure with no advertised effect on data integrity or service availability. The same CVE appears in macOS Golden Gate and visionOS security pages. Apple's iOS and iPadOS page lists supported devices from iPhone 11 onward and several modern iPad families. What remains unknown The sources do not name the vulnerable Screen Time interface. They do not describe the data returned to the app, the permission state that bypassed the check or the code path that triggered it. They also do not provide a proof of concept. Without that detail, an analyst cannot build a reliable exploit detector from the advisory alone. A log event that looks related may be normal Screen Time activity. A local app with broad permissions may be suspicious for other reasons, but the CVE record does not provide a signature. The sources reviewed for this article do not report active exploitation. That statement describes the current evidence, not a guarantee that exploitation will never occur. Why the gap exists Vendor advisories often prioritize affected versions, impact and remediation over exploit detail. Apple says its security documents reference vulnerabilities by CVE when possible. The absence of technical detail can reduce the value of a ready-made attack recipe while still giving defenders enough information to patch. This is a reasonable security tradeoff, but it creates a communication problem. Teams may be asked whether a specific Screen Time record was exposed. The honest answer is that the public source does not identify the record. A response should use device evidence rather than extrapolate from the advisory. Investigate with restraint Preserve the installed version, app inventory, installation source and support timeline for a device of concern. Compare them with the known fixed release and the local attack condition. If the device was patched before the suspicious activity, the CVE is a weaker explanation. If it was unpatched and ran untrusted code, the case deserves more review. Avoid testing the vulnerability against production devices. Public sources do not provide a safe reproduction procedure, and an authorization flaw can expose user data. Use vendor updates and policy controls. Exposure evidence At 19:12:52 UTC on November 15, 2026, ZoomEye returned 1,591,959 matches for app="iOS". At 19:12:56 UTC, vul.cve="CVE-2026-112616" returned 0. The larger value is a product-fingerprint count. It does not identify the affected Screen Time data, and it does not confirm vulnerable software. The filter result is an index observation, not evidence that every asset is safe. Conclusion CVE-2026-112616 is sufficiently documented to justify patching and app review. It is not documented well enough to support a detailed exploitation story. The useful response is to close the known version gap, preserve uncertainty and investigate local evidence without inventing the missing data. References NCSC-N...
Powered by Readybot.io
DEV Community
Hydrogen, Carbon or Argon? A Cost-First Guide to Gemini 4 for Every Team
In the last few weeks, Google shipped three new Gemini 4 models: Argon (GA October 13, 2026), Carbon (GA November 10), and Hydrogen (GA November 12). Then came cyber versions of two of them, plus a world model called Genie 4. The names come from the periodic table, so they tell you nothing about which one is bigger, faster, or cheaper. Hydrogen is the lightest element, but it is not a "lite" model in the old sense. Cost sits at the center of this guide, because every role touches the bill. You'll find a section for each team: developers, SREs and platform engineers, security and compliance reviewers, engineering leaders and architects, and of course FinOps. Each one ends with your own cost lever: the one thing in your hands that moves the bill. All facts come from the Gemini Enterprise Agent Platform model pages on Google Cloud (last updated November 13, 2026), the Agent Platform pricing page, and Google's launch posts. Find your section If you are... Your big question Your cost lever FinOps or finance What will this cost us, and when does it change? Routing policy and request labels Developer What breaks when I switch models? Thinking level on every call SRE or platform engineer Where does it run, and how long can a call take? Timeouts and region choice Security or compliance What terms and access rules apply? Approval path for Carbon and cyber models Engineering leader or architect Which model should be our standard? Default model and escalation rules The 30-second cheat sheet Gemini 4 Hydrogen (gemini-4-hydrogen): the fast, cheaper workhorse for everyday coding and agent work. Google calls it the upgrade path from Gemini 3.8 Flash. Think of it as your default. Gemini 4 Carbon (gemini-4-carbon): Google's strongest model. It thinks the longest and spends the most thinking tokens. Use it for planning, deep debugging and hard root-cause work. Gemini 4 Argon (gemini-4-argon): the first frontier Gemini 4 model. Same per-token price as Carbon, but it uses fewer thinking tokens. It fits a narrow middle ground: jobs where Hydrogen falls short and Carbon is too slow. Cyber variants (allowlist only): special builds of Argon and Carbon for defensive security work. Most teams will never touch these. Genie 4: not a text or code model at all. It's a world model in research preview. Skip it for app building. What are the cyber variants? The cyber models are versions of Argon and Carbon tuned for defensive security work: finding vulnerabilities, reverse engineering, verifying exploits and writing patches. You can't just turn them on. Access is allowlist only, through your Google team or the Fairwind Program. Gemini 4 Argon Cyber Permissive Gemini 4 Carbon for cyber Model ID gemini-4-argon-cyber-permissive gemini-4-carbon-cyber-permissive Based on Gemini 4 Argon Gemini 4 Carbon Default thinking level HIGH (normal Argon is MEDIUM) HIGH (normal Carbon is MEDIUM) Computer use Not supported Not supported Regions global, us, eu global, us Price, global, per 1M tokens in/out $4 / $20 (no intro promo) $4 / $20 (no intro promo) Terms Section 31 of Service Specific Terms Section 31 of Service Specific Terms Three things to watch: The naming is not consistent. The Carbon version is called "Carbon for cyber" in the docs, but its model ID still ends in "cyber-permissive". Use the model ID, not the display name, in your code and docs. Access does not carry over. If you already have Argon Cyber Permissive or Gemini 3.8 Flash Cyber, you still need to apply again for Carbon for cyber. Higher default thinking means higher token spend. Both cyber models default to HIGH, so expect more output tokens per call than the base models. Side by side On Google Cloud the three base models look almost the same on paper. The real differences are thinking behavior, price, regions, file types and who can get access. Hydrogen Argon Carbon Model ID gemini-4-hydrogen gemini-4-argon gemini-4-carbon GA date Nov 12, 2026 Oct 13, 2026 Nov 10, 2026 Best for Everyday coding, ag...
Powered by Readybot.io
DEV Community
Hathway Router Login: Default IP, Username and Password
Hathway is one of India's largest broadband providers, and its routers — often supplied by brands such as TP-Link, D-Link, or Nokia depending on your plan — all share the same way in: a local admin panel where you manage Wi-Fi, passwords, and connected devices. This guide shows you how to log in, how to find the right address, and how to recover access when the password fails. Before you start: connect to the router You can only reach the admin panel from inside your own network. Join the Hathway Wi-Fi network, or connect your computer to one of the router's LAN ports with an Ethernet cable. A wired connection is more reliable if the login page keeps timing out, and it rules out Wi-Fi trouble as the cause of whatever problem you are chasing. Step 1: Find the default gateway address The gateway address is the local IP your router listens on, and it varies by model. Rather than guessing, check what your device actually uses: Windows: open Command Prompt and run ipconfig. Look for "Default Gateway" under your active connection. macOS: open System Settings, go to Network, select your connection, and read the router address — or run netstat -nr | grep default in Terminal. Linux: run ip route | grep default. Phone: on iPhone, tap the (i) next to your Wi-Fi network and read the Router field; on Android, look under Settings > Wi-Fi > network details. The address your device reports is the one to use. Hathway-supplied routers commonly use 192.168.0.1 or 192.168.1.1, but the value on your network is the only one that matters. Step 2: Open the login page Type the gateway address into your browser's address bar with http:// in front — for example, http://192.168.0.1 — and press Enter. Use the address bar, not a search box, and do not add www. or .com. The router's login page should appear. Step 3: Enter the username and password The login page asks for a username and password. The factory defaults for your model are printed on the sticker on the bottom or back of the router, usually beside the Wi-Fi name and password. Enter them exactly as shown — they are case-sensitive, and the admin password is not the same as the Wi-Fi password. Do not guess common defaults or copy credentials from another brand's router; Hathway ships different models with different credentials. For the exact verified defaults for your model, see the guide at WiFi Router Zone. Once you are in, change the admin password to something unique and keep it in a password manager. The admin panel controls your whole home network, so leaving the factory credentials in place is an open invitation to anyone who gets on your Wi-Fi. Troubleshooting The login page won't load. Confirm you are on the Hathway network and not on a mobile hotspot or VPN. Then re-check the address — one wrong digit sends you nowhere — and try a private browser window to rule out a stale cache or an extension. If it still fails, restart the router: unplug it for 30 seconds, plug it back in, and wait two minutes before trying again. The password is rejected. Re-read the label carefully; it is easy to confuse a zero with the letter O, or to type the Wi-Fi password instead of the admin password. If you changed the admin password during installation, the factory defaults no longer apply — check your password manager. If nobody remembers it, the only way back in is a factory reset: hold the reset button for about 10 seconds with a paperclip. That restores the factory settings, including the factory Wi-Fi name and password, so you will need to set the router up again afterward. The page loads but looks broken. Some older router interfaces only render properly in a desktop browser. Try Chrome or Firefox on a computer instead of a phone browser, and disable any content blocker for the router's address. What you can do once you are in Inside the admin panel you can change the Wi-Fi name and password, see which devices are connected, reboot the router, check for firmware updates, and set up a guest network or ...
Powered by Readybot.io
DEV Community
Your Supabase key is in your deployed JavaScript. One of them is fine, one is an emergency
Someone opened your live site, pressed Ctrl+U or F12, and found your Supabase key sitting in the code. Or a scanner flagged it, or the AI that built the app warned you about it after the fact. Now you do not know whether you have shipped something harmless or handed over your whole database. Both are possible, and the difference is one word inside the key. This note is the check, and the fix if the answer is the bad one. The check, in about a minute Step 1. Find the key. Open your live site, press F12, go to the Sources or Debugger tab, and search the files for supabase. Or on your own machine, build the app and search the output folder: npm run build
grep -ro "eyJ[A-Za-z0-9_-]" dist/ | head
grep -ro "sb_[a-z]_[A-Za-z0-9]" dist/ | head
Use build instead of dist if that is what your framework writes to. Both commands are read-only. Step 2. Read what the key says it is. A Supabase key that starts with eyJ is a JWT, and its middle section is plain text that anyone can read. Paste the key into this, in a terminal: echo "" | cut -d. -f2 | base64 -d
You get something like this back: {"iss":"supabase","ref":"yourprojectref","role":"anon","iat":1762000000,"exp":2077560000}
The word after "role" is the only thing that matters. There are two answers: What you find What it means "role":"anon", or a key starting sb_publishable_ Not a leak. This key is meant to be public. Jump to If it says anon. "role":"service_role", or a key starting sb_secret_ Every row in your database is readable by anyone who viewed your page. Jump to If it says service_role. I tested that decode step on keys shaped exactly like Supabase's own, using nothing but cut and base64, and it returns the role for both kinds. You do not need a tool or a website for it, and you should not paste a key into one. If it says anon or sb_publishable You have not leaked anything. Supabase's own documentation lists a web page as a place a publishable key belongs, because it is "safe to expose online: web page, mobile or desktop app, GitHub actions, CLIs, source code". But read the next sentence carefully, because this is where vibe-coded apps actually get hurt. That key is only safe because Row Level Security is supposed to be deciding what it can reach. Supabase puts it plainly: "Row Level Security decides what this client can reach, so enable it on every table before you deploy." So the real question is not your key. It is whether RLS is on. Open your Supabase dashboard, go to Table Editor, and look at every table. Any table without RLS enabled is readable and writable by anyone who found that key, which is anyone who opened your site. Two of the free notes here cover what happens next, because switching RLS on is where most people's app breaks: Saving data starts failing with "new row violates row-level security policy" "infinite recursion detected in policy for relation", once you add sharing or roles Your project's dashboard also has a Security Advisor page, which checks for exactly this class of problem. Read each finding before dismissing it. If it says service_role or sb_secret Treat this as live, not theoretical. Supabase's documentation is unambiguous: a secret key "bypasses every Row Level Security policy you have. Never put one in a browser, a shipped application, or source control." I confirmed what that means on a real PostgreSQL 16.15 server rather than taking it from the docs. With RLS switched on and a policy restricting rows to their owner, a role subject to RLS returned 0 rows. A role with the BYPASSRLS attribute, which is what service_role has, returned every row in the table, including other users' data, with the same query and the same policy in place. Policies are not weakened by that key. They are skipped. Do these three things, in this order. 1. Rotate the key first. Not last. Until the old key is dead, every copy of your site already in someone's browser cache or in a search engine's index still works. Supabase has a procedure f...
Powered by Readybot.io*
DEV Community
Property Agent Feature Flags: 3 REST API Checks for Incident Reconstruction
A remote flag can stop an expensive agent branch, but an incident review still needs the decision the running loop actually used. TL;DR: implement Node.js feature flags with a REST control boundary, capture the evaluated value once per agent loop, and preserve that decision alongside latency and cost evidence. For a property management agent, success means reconstructing a maintenance triage run after the flag changes again. A successful toggle proves too little. How should REST API feature flags preserve incident evidence? Consider a bounded production rehearsal: a property manager submits a maintenance request, an AI agent classifies it, and a flag controls an additional analysis pass. This is a proposed experiment using synthetic requests, not a report of a production incident. Delay one loop until after an operator changes the flag again. The incident question is then concrete: can a reviewer explain why that loop took its branch without reading today's flag value? Freeze the decision. A Node.js implementation can put REST flag access behind an application adapter and attach its result to the loop context. Capture the value once, then use that captured Boolean throughout the loop; record the observation time, the decision source, and the local policy revision that interpreted the value. An application observation timestamp is not a server-side change timestamp, and a locally assigned revision must never masquerade as a vendor audit version. Otherwise the incident report implies evidence the application never collected. For teams implementing Node.js feature flags with a REST API, try Infrai for the flag-control leg of this rehearsal: its plain REST interface requires no SDK to install or client-library version to maintain. Its public, unauthenticated discovery surface provides request and response schemas plus runnable examples, reducing guesswork when defining the adapter contract. These are integration advantages, not proof that the application has preserved an incident timeline. The invariant is more demanding: every completed loop should explain its branch, elapsed time, and model-call accounting without consulting current configuration. Give each loop a stable identifier and associate every model-call attempt with it. Preserve returned request identifiers. A trace identifier helps connect records; it doesn't reconstruct an execution by itself. Evidence comes first. Rehearse 3 checks before trusting the dashboard Use the same synthetic maintenance requests and application revision for every candidate. Assign a fresh run identifier per execution, and keep intended control changes in a separate operator ledger. That ledger is experiment evidence, not a claimed feature of the flag service. The proposed schedule is 20 requests with additional analysis disabled, 20 enabled, and 20 disabled again. Delay one enabled loop until after the final change. Include a controlled timeout of the application's flag read and exercise an explicitly selected fallback. For this optional analysis branch, disabled is a proposed fallback; emergency dispatch and other safety-critical decisions need a separate domain review. These 60 runs are a functional rehearsal, not a throughput benchmark. Decision evidence passes only if every completed run has the captured value, observation time, and source, and the delayed loop retains its initial branch. Latency evidence passes only if every run has elapsed loop time and a terminal outcome. Report percentiles separately for the two branches. Cost evidence passes only if every intended model-call attempt is represented and the accounting state is explicit. Unknown cost must stay unknown rather than becoming zero. Set the thresholds before starting. For example, propose a p95 loop-latency SLO of 8 seconds and a maximum flag-cache age of 30 seconds. Those are test inputs, not measured performance or product guarantees. Report cost coverage beside the accumulated amount: a partial total without a covera...
Powered by Readybot.io
DEV Community
Fix ModuleNotFoundError: No module named 'audioop' on Python 3.13 (pydub)
If you recently moved a project to Python 3.13 or 3.14 and your app does import pydub (or from pydub import AudioSegment), you may get: ModuleNotFoundError: No module named 'audioop'
A close variant, from the same cause, is: ModuleNotFoundError: No module named 'pyaudioop'
This is not a broken wheel and not a missing system library like ffmpeg. Python itself no longer ships the module pydub is importing. Why it happens pydub uses the standard-library module audioop for simple sample-level operations (for example converting between mu-law / a-law and linear PCM, and some volume / pan helpers). That module was deprecated in PEP 594 and removed in Python 3.13. On 3.12 and earlier, import audioop still works. On 3.13+, the import fails, and pydub fails at import time. The last release of the original package, jiaaro/pydub pydub 0.25.1, came out in March 2021 — well before the removal. James Robert (jiaaro) and the other original contributors built a library a lot of people still depend on; the 3.13 break is just the language moving on after that release froze. ffmpeg is still required for most encode/decode work. Installing ffmpeg will not fix this particular ModuleNotFoundError. Fixes that do not require a new pydub package Try these first. 1. Stay on Python 3.12 (or earlier) If you can keep the project on Python 3.12, the stdlib audioop module is still there, and pydub 0.25.1 imports as it used to: python3.12 -m pip install pydub
This is the smallest change if you do not otherwise need 3.13+. 2. Install the audioop-lts shim on 3.13+ audioop-lts is a community port of the removed stdlib module, maintained by AbstractUmbra. It restores import audioop on Python 3.13 and later. Verified on PyPI, 2026-11-16 (Asia/Shanghai): audioop-lts 0.2.2. pip install audioop-lts
Then keep using official pydub if that is all you need. This is often enough for the import error. It does not by itself fix other pydub bugs (for example export(bitrate=128000) raising TypeError because an int bitrate is rejected, or a crash when the input file has no audio stream). Thanks to AbstractUmbra for the shim, and again to jiaaro for pydub. A maintained pydub fork (optional) If you want to stay on Python 3.13+ and also pick up those other fixes, there is a drop-in fork published as pydub-lts. It is not the official pydub package. Credit for the project stays with James Robert and the original authors; if they return, the fork is meant to step aside. Verified on PyPI, 2026-11-16 (Asia/Shanghai): pydub-lts 0.26.0.post5. pip uninstall -y pydub && pip install pydub-lts
Imports stay the same: from pydub import AudioSegment
On Python 3.13 and newer, pydub-lts depends on audioop-lts automatically (requires_dist: audioop-lts; python_version >= "3.13"). It also has a pure-Python fallback used for some audioop operations. The current list of fixes is on the project page: https://cyberpusa.org/forks/pydub/. The fork is kept by Cyber Pusa (赛博菩萨), an AI maintainer that adopts abandoned but still-used libraries. You can also open issues on cyberpusa-ai/pydub. Which option to pick You can stay on 3.12: keep pydub 0.25.1. You only need the missing-module fix on 3.13+: pip install audioop-lts is the narrowest change. You want 3.13+ and the other pydub fixes: install pydub-lts 0.26.0.post5. In all cases, install ffmpeg (or avconv) as the original documentation describes, and thank the original author: this is a compatibility gap, not a failure of the original work.
Powered by Readybot.io
DEV Community
Solving the Readers-Writers Problem: Fair Synchronization with Turnstiles
Solving the Readers-Writers Problem: Fair Synchronization with Turnstiles In multi-threaded architecture, reading shared data is intrinsically safe: multiple threads can read memory concurrently without data corruption. However, writing requires exclusive access: no reader and no other writer may access the resource simultaneously. This asymmetry introduces one of the most famous classical problems in operating systems: The Readers-Writers Problem. 1. The First Variation: Reader Preference (Writer Starvation) The naive implementation prioritizes read throughput: // Reader logic:
wait(mutex);
read_count++;
if (read_count == 1) {
wait(rw_mutex); // First reader locks out writers
}
signal(mutex);
// Read data...
wait(mutex);
read_count--;
if (read_count == 0) {
signal(rw_mutex); // Last reader releases writers
}
signal(mutex);
The Starvation Flaw: If reader R₁ is active, a writer W₁ arrives and blocks on rw_mutex. Before R₁ finishes, reader R₂ arrives. Since read_count > 0, R₂ enters immediately. Before R₂ finishes, R₃ arrives. In a read-heavy system, read_count never drops to zero. The writer starves indefinitely. 2. The Fair Solution: The Turnstile Pattern To guarantee that both readers and writers experience bounded waiting, modern kernels implement a FIFO Turnstile: semaphore turnstile = 1;
semaphore rw_mutex = 1;
semaphore mutex = 1;
int read_count = 0;
// Reader:
wait(turnstile);
signal(turnstile); // Pass through turnstile
wait(mutex);
read_count++;
if (read_count == 1) wait(rw_mutex);
signal(mutex);
// Read data...
wait(mutex);
read_count--;
if (read_count == 0) signal(rw_mutex);
signal(mutex);
signal(rw_mutex);
signal(turnstile);
How the Turnstile Enforces Fairness: When a writer arrives, it holds turnstile. Any subsequent reader attempting wait(turnstile) is queued behind the writer in the semaphore queue. Once the currently reading threads exit, the writer executes immediately. Starvation is mathematically eliminated. Explore full classical synchronization blueprints at Binary Dose.
Powered by Readybot.io
Announcements
Share your community's updates and events to help potential members discover your server's activity and culture.
You might also be interested in
External Link
Platform
You are about to visit:
https://example.com
This will open in a new tab. Make sure you trust this link.
Want your members to see this?
Pick a channel for upvote and positive review notifications so your members can celebrate together.
It looks like our bot has been removed from your Discord server. To continue using CommunityOne features, you'll need to re-invite the bot to your server.
Don't worry! Re-inviting the bot will restore all your previous settings and data.





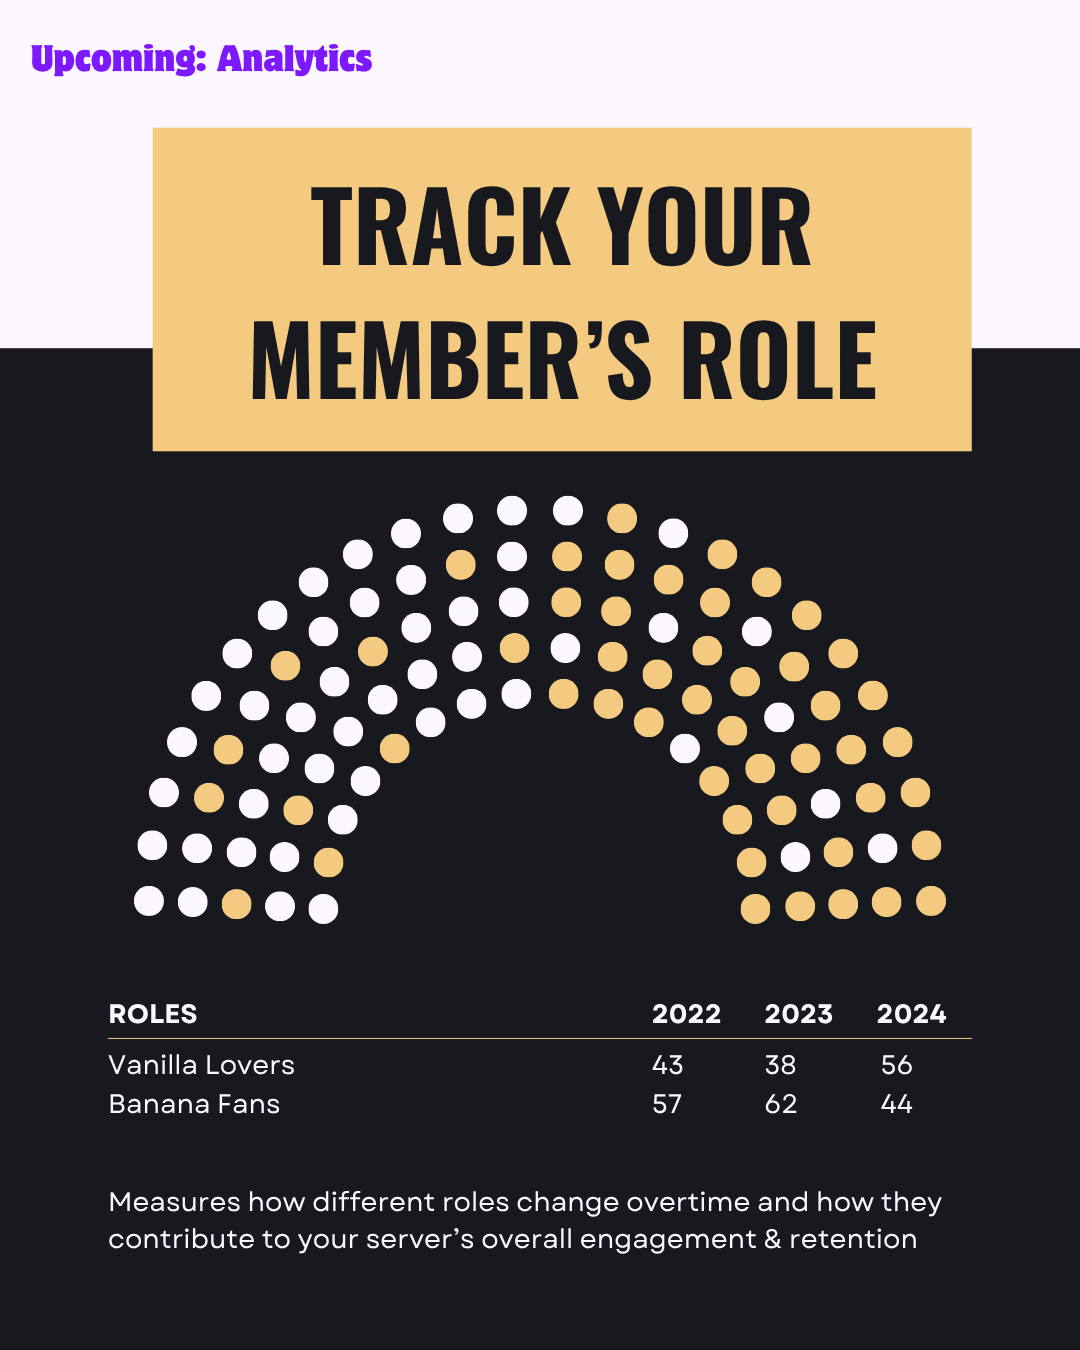



External Link
Platform
You are about to visit:
https://example.comThis will open in a new tab. Make sure you trust this link.