Pixel

Pixel Updates & Events

Server Updates & Events

Announcements

Diagnose a Slow SQL Server in 4 Steps

DEV Community

Why Is My SQL Server Slow? A 4-Step Diagnosis with Blocking, Wait Stats, Execution Plans and Missing Indexes

Your SQL Server is slow — but "slow" is a symptom, not a diagnosis. In this tutorial you will diagnose one genuinely slow query the way a mechanic finds a car fault: with four checks, in a fixed order, each producing evidence instead of a guess. The four checks are: (1) is anything blocking the query, (2) what is the server waiting on, (3) what does the execution plan say, and (4) which index is missing. Our test query starts out touching 12,388 pages to return about 2,061 rows. By the end of this post it touches 15 pages — and you will know exactly which check found the problem, because every number here was measured on the demo server while writing this post. What you need A SQL Server you can practise on — this post uses SQL Server 2025 (17.x), measured build 17.0.5065.9 (RTM-CU11) on Linux, driven from a terminal with sqlcmd. Every query below also runs unchanged in a query window in SQL Server Management Studio (SSMS) 22 on Windows — a section near the end maps each step to SSMS. A throwaway database you may break. We create one below called DemoDb. Permission to see the server's diagnostic views: the wait and blocking views used here need the VIEW SERVER PERFORMANCE STATE permission (on your own demo instance, your admin login already has it). No downloads beyond the database engine itself. Everything in this diagnosis is built into SQL Server. The whole method, on one screen Keep this map in mind. Each check below answers exactly one question, and each ends with evidence on screen: a row from a diagnostic view, an operator in a plan, or a count of pages read. Nothing is fixed by guessing. Step 0 — Build the slow scene We need a table big enough to be slow and a query simple enough to reason about. Create the database and an Orders table with 200,000 rows — orders from eight Canadian cities — with no index on the City column. That missing index is the planted fault; everything else about the setup is ordinary. CREATE DATABASE DemoDb;
GO
USE DemoDb;
GO
CREATE TABLE dbo.Orders (
OrderId INT IDENTITY(1,1) CONSTRAINT PK_Orders PRIMARY KEY,
CustomerId INT NOT NULL,
City NVARCHAR(40) NOT NULL,
OrderDate DATE NOT NULL,
Total DECIMAL(10,2) NOT NULL,
Notes NVARCHAR(300) NOT NULL
);
GO
Fill it with generated rows (the full setup script, including the row generator, is in the companion code at the end of this post). Toronto is deliberately rare — about one percent of the table — because a city report is exactly the kind of query a real application runs. The demo instance reporting its version, and the finished table: 200,000 orders, 2,061 of them in Toronto. Step 1 — Run the hero query and take its fingerprints Our hero query is the city report: show me the orders from Toronto. Before diagnosing anything, measure it. Two counters matter: Elapsed time — how long the query took, in milliseconds. Logical reads — how many 8 KB pages of the table SQL Server touched while answering. Pages are the honest yardstick: they do not depend on how fast your disk happens to be. SET STATISTICS IO ON;
SET STATISTICS TIME ON;
SELECT OrderId, CustomerId, OrderDate, Total
FROM dbo.Orders
WHERE City = N'Toronto';
First run: elapsed 15 ms, and 12,388 logical reads — the server touched 12,388 pages to fetch about 2,061 rows. That ratio is the smell. Now we find out why, one check at a time. Check 1 — Is anything blocking it? The idea in plain words. When a query changes a row, SQL Server locks that row until the change is finished — like one person editing a shared document while everyone else waits. A transaction is a group of changes treated as one unit: either all of them happen, or none do. If a transaction is left open, its locks stay held, and every other query that needs those rows queues behind it. On a busy server this — not a missing index — is the most common reason a healthy query suddenly "hangs". Prove it to yourself with two sessions. In session A, open a tra...

Powered by Readybot.io

Diagnose a Slow SQL Server in 4 Steps

Namespace Runners: GitHub Actions Pricing Explained

DEV Community

What Namespace runners are, and how unit minutes work

Namespace runners are GitHub Actions runners sold by the compute unit rather than the wall-clock minute, where one unit is 1 vCPU plus 2 GB of RAM for a minute, multiplied by 1 on Linux, 2 on Windows and 10 on macOS. You select one either by creating a profile in the dashboard and naming it in runs-on, or by spelling the whole machine out in a label. The Team plan is 100,000 unit minutes, so the machine you pick decides how many wall-clock minutes that is. Shapes, multipliers and rates read from namespace.so on 20 September 2026. Namespace Cloud sells compute for CI and development: these GitHub Actions runners, Devboxes, remote Docker builders, and caches for Bazel, Turborepo and the container registry underneath them. The runners are a drop-in replacement, adopted by connecting your GitHub organization and changing one line. Everything below was read from namespace.so on 20 September 2026, including its machine-readable pricing page, and is dated here. For the head-to-heads, Namespace against GitHub-hosted runners and Namespace against Blacksmith carry the comparison tables. Two ways to ask for a machine The first is a profile. You create it in the dashboard, pick the OS, architecture and shape, name it, and reference that name: runs-on: namespace-profile-big-apple. Caching options, runner controls and other settings live on the profile, so the workflow stays short and the configuration is centralized. The second puts everything in the label, which keeps the machine under version control with the workflow that needs it. The grammar is nscloud-{os}-{arch}-{shape}, with optional -with-cache, -with-features and -with-builders suffixes and companion labels underneath. One rule matters more than the rest: only one nscloud label is allowed, and a job with two of them, or with an invalid one, is never scheduled at all. jobs:
tests:
- runs-on: ubuntu-latest
+ runs-on:
+ - nscloud-ubuntu-24.04-amd64-8x16-with-cache
+ - nscloud-cache-tag-my-repo-e2e
+ - nscloud-cache-size-50gb
The shapes, and what a unit minute is A shape is written vCPU by memory: 4x8 is 4 vCPU with 8 GB. Standard Linux and Windows shapes are multiples of 1 vCPU and 2 GB, and a shape with a different ratio is counted as the larger of its vCPU count and half its gigabytes, so 8 vCPU with 32 GB counts as 16 units a minute rather than 8. Ubuntu runs 20.04 through 26.04 on amd64 and arm64, Windows Server 2022 on amd64, and macOS from Sonoma to Tahoe on Apple M5 Max or M4 Pro. Usage is then accounted in unit minutes: vCPU count times minutes times the platform multiplier. Namespace prices those two ways, prepaid through a plan or as overage, and the difference is exactly 50%. Shape Units per minute Prepaid Overage Minutes the $100 Team plan buys Linux 2 vCPU, 4 GB 2 $0.002 $0.003 50,000 Linux 2 vCPU, 8 GB 4 $0.004 $0.006 25,000 Linux 4 vCPU, 16 GB 8 $0.008 $0.012 12,500 Linux 8 vCPU, 32 GB 16 $0.016 $0.024 6,250 Windows 2 vCPU, 4 GB 4 $0.004 $0.006 25,000 macOS 6 vCPU, 14 GB 60 $0.06 $0.09 1,667 Two readings of that table decide whether Namespace is cheap for you. The shape that matches a standard GitHub-hosted Linux runner, 2 vCPU with 8 GB, is $0.004 a minute prepaid, a third below GitHub's $0.006. The shape one row above it is half that, and it is also half the memory, which is the comparison Namespace's own rate card invites and the one to be careful with. The plans are the prepaid rate rather than a fee on top of it: Team is $100 a month for 100,000 unit minutes, Business is $250 for 250,000, and the Developer tier is pay as you go with no allowance. Rounding is published too, and it rounds down more often than GitHub does: there is a one-minute minimum, and the next 15 seconds are dropped, so 30 seconds bills as 1 minute and 70 seconds also bills as 1. Cache volumes, which are the real feature A cache volume is a block device that persists between runs and mounts at /cache. You attach one by adding -with-cache to the machine label and a ...

Powered by Readybot.io

Namespace Runners: GitHub Actions Pricing Explained

DigImg vs TinyPNG vs ShortPixel: Size and SSIM

DEV Community

I measured DigImg vs TinyPNG vs ShortPixel on the same images (bytes + SSIM)

A smaller image file is useful. A smaller file that visibly damages a logo, screenshot, or photo is not always a win. So instead of comparing marketing claims, I ran the same four source images through DigImg, TinyPNG, and ShortPixel. I downloaded each result, measured the actual output bytes, and calculated SSIM with the same scikit-image workflow used for DigImg's own measurements. This is a small, reproducible spot check — not a universal ranking of image compressors. The goal is to show the trade-offs on four different image types. Why measure bytes and quality together A compression number on its own is easy to flatter. "Up to 80% smaller" can be true for one photo at one aggressive setting and misleading for everything else. File size tells you what you save; a quality metric tells you what you paid for it. Reporting only one of the two lets a tool look better than it is. That is why every lossy result below carries both an exact byte count and an SSIM score, and every lossless result is labelled pixel-exact. The point is not to crown a winner. It is to make the trade-off visible so you can choose for your own image. The test setup Four identical source images: a photo, a transparent logo, a flat graphic, and a UI screenshot. The downloaded files were measured by actual file size, not a UI estimate. Quality was compared using SSIM under the same scikit-image measurement approach. TinyPNG and ShortPixel were tested through their web interfaces. ShortPixel used the web Lossy/SmartCompress path. This is not an API-to-API benchmark. Different compression modes and settings can change the result. SSIM (structural similarity) compares the decoded output against the source on a 0–1 scale, where 1 means identical structure. I decoded each downloaded file and ran the same calculation DigImg uses internally, so the numbers are comparable across tools. SSIM is a useful proxy, not a substitute for looking at the image — a high score does not guarantee every detail survives, which is why the lossless/lossy label matters as much as the score. Results: the same four inputs Source image DigImg result TinyPNG result ShortPixel result What the test shows Photo, 73.5 KB source JPEG 32.5 KB, SSIM 0.980; WebP 19.1 KB, SSIM 0.974 JPEG 52.1 KB, SSIM 0.988 JPEG 45.5 KB, SSIM 0.978 DigImg produced the smallest JPEG in this run. Its WebP was smaller still, with a lower SSIM than the JPEG outputs. TinyPNG's JPEG scored the highest SSIM. Transparent logo PNG 2.66 KB, lossless / pixel-exact PNG 2.63 KB, lossless / pixel-exact PNG 2.66 KB, lossless / pixel-exact Effectively a tie. All three outputs were pixel-exact for this input. Flat graphic PNG 2.69 KB, lossless / pixel-exact PNG 2.80 KB, lossless / pixel-exact PNG 2.69 KB, lossless / pixel-exact DigImg and ShortPixel tied on bytes; both were slightly smaller than TinyPNG in this run. UI screenshot PNG 1.70 KB, lossless / pixel-exact PNG 2.82 KB, lossless / pixel-exact PNG 1.38 KB, SSIM 0.9957 (lossy) ShortPixel made the smallest file, but it was lossy. DigImg's output was the smallest lossless option in this run. What I would take away 1. There is no single winner across every image type For the photo, DigImg's JPEG was smaller than the JPEG outputs from TinyPNG and ShortPixel in this run. TinyPNG retained the highest SSIM score among those JPEG results. DigImg's WebP was smaller than all three JPEG files, but it is a different output format and had a lower SSIM score than the JPEG results. For the transparent logo, the three tools were effectively tied. For the flat graphic, DigImg and ShortPixel tied. For the screenshot, ShortPixel produced the smallest file, while DigImg produced the smallest pixel-exact lossless PNG. That is why a useful comparison should show both size and quality — and should say when a smaller output is lossy. 2. "Lossless" is a practical choice, not just a checkbox For logos, diagrams, and screenshots, preserving exact pixels can matter more than shaving off another f...

Powered by Readybot.io

DigImg vs TinyPNG vs ShortPixel: Size and SSIM

SLH-DSA Signature Sizes: What Teams Need to Know

DEV Community

SLH-DSA changes signature size budgets before it changes the signature model

SLH-DSA changes signature size budgets before it changes the signature model SLH-DSA is a stateless hash-based signature scheme standardized in FIPS 205. It removes the need to track a signing counter between operations, which makes backup, replication, and failover easier than with stateful hash-based signatures. The tradeoff appears in the bytes and CPU work attached to each signature, not in the basic promise that a signature authenticates a message. FIPS 205 approves twelve parameter sets. Six parameter combinations are instantiated with SHA-2 or SHAKE. The names also distinguish a small-signature variant from a fast-signing variant. Teams that compare only the security level will miss this difference. A small deployment may need the fast variant to keep a signing service within its latency budget. A bandwidth-limited update channel may need the small variant even when its signing path is slower. Size is part of the protocol NIST SP 800-230 records the smallest signature sizes in the base standard as 7,856 bytes at security level 1, 16,224 bytes at level 3, and 29,792 bytes at level 5. Those values exclude the surrounding certificate, envelope, log entry, or API framing. A system with a fixed 4 KB request limit cannot move to the smallest of these signatures without changing its transport contract. Find every place where a signature is stored: release manifests, package metadata, audit logs, API payloads, configuration bundles, and long-lived archives. Check database columns, message limits, compression assumptions, and base64 overhead. A signature that passes in a unit test can still fail at a proxy with a smaller body limit. The signing capacity stated for the full design is large, but capacity is not a reason to share one private key across unrelated trust domains. Separate keys by product, environment, and signing policy. Record the parameter set and key identifier with every signature so a verifier does not infer the wrong algorithm from the signer's name. Stateless does not mean policy-free A stateless signer does not need a monotonically increasing counter, but it still needs a protected private key. An attacker who obtains the key can sign for as long as the verifier accepts it. Rotation, revocation, approval, and audit records remain deployment controls. Verification also has a resource budget. Hash-based verification is generally cheaper than signing, but a service that verifies large numbers of signatures can still exhaust CPU or memory. Put bounded sizes and time budgets around untrusted input. Reject unknown parameter sets before allocating buffers. Prepare a migration test that signs a representative artifact with each approved parameter set, measures the full encoded size, and runs every consumer in the path. Include the oldest supported client, the release mirror, the logging pipeline, and the recovery procedure. Where an SLH-DSA migration does not fit, state the limiting component rather than hiding it behind an "algorithm not supported" error. References NIST FIPS 205, Stateless Hash-Based Digital Signature Standard NIST SP 800-230 initial public draft, Additional SLH-DSA Parameter Sets for Limited-Signature Use Cases

Powered by Readybot.io

SLH-DSA Signature Sizes: What Teams Need to Know

Whose Bug Was It? Lessons from 22 Integration Runs

DEV Community

Whose Bug Was It

Twenty-three defects in the last twenty-two runs: eleven in the collector, four in config, three in other services, and five of our own. 👋 Hi, I'm Anton - a software engineer. These days I work on a platform: contracts, generated code, data paths and the tooling around them. Running notes live on my GitHub: github.com/brilliant-almazov. The count covers only the last twenty-two acceptance runs of the week, where every fix is itemised; one collector fix is still in review and the three defects in other services are open and planned, and both are marked that way below. This is part 4 of the series on one week of integration acceptance across a whole chain of services, after months of doing it the slow way. Maybe you already do it better, maybe you'd do it another way - this is how it went, and where it stops. In real life The whole system is a zoo. The services are the residents, the bus is the paths, and acceptance is the vet - Pickle, a guinea pig with a card for each of eighteen enclosures. Nora is the keeper. Pickle's week of rounds found plenty. Biscuit, the courier dog, had a sore paw, and when Pickle confirmed it he said "Told you so!" with great satisfaction. Miso the cat was wearing a name sign that said BISCUIT, and observed, without opening her eyes, "That sign is not mine." Nora went to fix the sign. At one enclosure the cure was next door - and Pip, the guide, pointed out that next door was closed. And then, five times in one week, the problem was Pickle. Mixed-up cards, an old page in the notebook, a medicine bottle already empty when she tried it again. Pickle admitted it: "I mixed up the cards." Ember the dragon, who misses nothing, added: "Five times. I counted." The sore paw is a defect in the collector's code. The wrong name sign is configuration on the stand. The closed door next door is a defect in another service, which the acceptance agent can find and cannot fix. And the vet's own mistakes are the acceptance side's false reds. The honest answer to "whose bug was it" has four parts, and one of them points back at the tester. The count The acceptance agent counted defects only over the last twenty-two runs of the week, because those are the runs where every fix is written down item by item. Earlier runs found things too; they are not in this number. Whose How many Status the collector's code 11 10 fixed, 1 fix in review configuration and the stand 4 fixed other services 3 open, planned there our own - the acceptance side 5 each listed with its fix total 23 Eleven in the collector The collector's eleven are the ordinary findings of driving a chain end to end: a status probe that could time out, a watchdog whose threshold did not arrive where it was needed and whose probe read the order's scenario, a queue for rebuilding a buffer, the body of a task post, a request-log row that was not closed when the answer never came, a delivery that had to happen exactly once, a priority that had to be clamped, configuration defaults, per-call balance answers in the emulator, and a number type in one provider's override. Two of them are worth telling. Priorities outside 0..100 were refused with an error. The owner's norm is different: a number on a scale is clamped to its bound, no error. After the fix, six rows went from red to green. And configuration defaults moved to one form for every leaf, so that a binary starts with sane values when a key is not set: # every configuration leaf, the form (paraphrased)
WATCHDOG_STATUS_TIMEOUT=${WATCHDOG_STATUS_TIMEOUT:-10s}
=${:-}
The one still in review is the most instructive. The emulator lets a test override its answer per call, and the balance override worked for one provider - five calls of five - and not for the other, zero of five, because a JSON number fell back to the fixture. The lesson the acceptance agent wrote down: measure each provider separately; a pass on one does not prove the other. The fix is written and waits for its rerun. # an emulator...

Powered by Readybot.io

Whose Bug Was It? Lessons from 22 Integration Runs

Free Claude Code Skill for SEO Reverse Engineering

DEV Community

A Free Claude Code Skill That Reads Any Site's SEO Playbook

One page template on Wise ranks for 151,315 organic searches. Not a blog post. Not a landing page. One template, filled thousands of times with currency pairs and country codes, pulling in six figures of monthly search volume while looking like nothing at all. The team at OpenSEO ran a teardown of Wise and put a number on it: the whole analysis cost under thirty cents. i read that and felt a specific kind of irritation. People pay agencies five figures a year for a version of this answer. And here it is, a slash command in Claude Code, a paperclip's worth of credits, and a markdown table telling you which page types carry the traffic. So i installed it. And then i read the actual SKILL.md, which is where things got more interesting than the announcement thread suggested. What it actually is /reverse-engineer-seo is a free, MIT-licensed skill. It was built by Every App, the company behind OpenSEO, and it lives on seo.party, their community skill marketplace. A skill is a folder with a SKILL.md file. Claude Code, Codex, or Cursor loads it when your request matches its description. No extension, no plugin API, just instructions plus a tool connection. The tool connection is the whole trick. The skill does not crawl anything. It calls OpenSEO's MCP server, which serves keyword, ranking, and backlink data bought from DataForSEO. That distinction matters more than the marketing implies. The skill is a procedure. The data is rented. Install is one line: gh skill install every-app/seo-party-skills reverse-engineer-seo --agent claude-code
Pinned to commit ce87df4, if you care about that sort of thing. You should. What it does when you run it The steps are specific in a way i didn't expect. It's not "analyze the site and give me insights." It's a numbered procedure with actual parameters. Size the domain with get_domain_overview and get_backlinks_overview Pull the top 100 keywords by traffic, add up the ones with the brand name in them, report that as brand share Find non-brand keywords ranking in the top 20, grouped by URL and then by section Measure each section with a separate call, comparing totalCount against the site total Count how many searches show the site as a source in Google's AI Overview Open the top pages of the three biggest sections and figure out how they're built Sort backlinks by domain rank, not by date, and look for what keeps attracting links That last instruction is the one that made me trust the skill. Sorting backlinks by newest is what most tools do by default, and it's useless for this question. Somebody thought about that. A run is about 12 OpenSEO calls and 250 to 300 credits. The skill says this itself. Which is honest, and also the first place the free story starts to wobble. The part developers will care about The output is a set of tables, not an essay. Playbook, scorecard, traffic engines, top pages, search patterns, link magnets, moves to copy, what won't copy. The "what won't copy" section is the thing i keep coming back to. It's a skill that tells you what not to steal from a competitor. Wise's currency converter pages work because Wise has a brand, a decade of links, and a product people search for by name. You can copy the template. You cannot copy the trust. The skill says so, in the output, without being asked. For developers and agents the appeal is different from the SEO consultant appeal. A consultant sells judgment. This sells a repeatable procedure that produces a file. You can run it on five competitors, diff the outputs, and hand the result to a coding agent that builds the pages. That's the real shift. Not analysis. Analysis that ends in a build spec. The hype, and what the hype skipped The launch numbers are real. OpenSEO's post pulled 450+ likes. Julian Goldie, who covers SEO tools to a large audience, posted about it and got 400+ likes and a YouTube video with 7,400 views in two days. There were LinkedIn reposts, Thai-language explainers, Facebook posts from marketing academies. ...

Powered by Readybot.io

Free Claude Code Skill for SEO Reverse Engineering

Fix GitHub Actions Missing Jobs Errors

DEV Community

GitHub Actions Required property is missing: jobs

Required property is missing: jobs is the workflow parser telling you that the root of the file has no jobs key where it expects one. The key is usually present in the file and has simply stopped being at the root, which is why the message reads as absurd the first time you see it next to a file that obviously has jobs in it. The left panel is the root key table reproduced in the body of this page, read from workflow-v1.0.json in actions/runner. What this error means The workflow does not run and GitHub shows an invalid-file annotation against the commit. The reported position is normally the very start of the file, because a missing property is reported against the mapping that should have contained it rather than against any line you wrote. That makes the message unhelpful on its own: it tells you what is absent and nothing about where it went. Often there are other lines above it in the same annotation, one per key that ended up somewhere unexpected, and those lines are the useful ones. If the annotation contains nothing but this single line, the file has genuinely lost its jobs key, either because it was never added or because the block that held it was moved under another key. ```Actions annotation, the last line, quoted from just-another-job-application-tracker#208 Invalid workflow file: .github/workflows/deploy.yml#L1 (Line: 1, Col: 3): Required property is missing: jobs

Common causes

Stray indentation at the root of the file

One leading space on the first line is enough. Everything below it is then nested inside a document whose root mapping has no keys the schema recognizes, and the required-property check fires against a root that looks empty even though the file is full.

The header of the file was lost in a merge or a squash

The name, trigger and jobs keys live in the first few lines, and a badly resolved conflict or a rewritten branch can take all of them at once while leaving the job bodies behind. The annotation then reports every job id as an unexpected root key, with the missing-property line last.

The jobs block ended up under another key

Usually under the trigger block, and usually from an automatic reindent. The key is still spelled correctly and is still in the file, which is why searching for the word finds nothing wrong and reading the column number does.

The file is not a workflow at all

A linter configuration, an action manifest or a Dependabot file that has been saved into the workflows directory is read as a workflow and rejected. The message is the same, and the fix is to move the file out rather than to add a jobs key to it.

How to fix it

Check column one before anything else

  1. Open the file and confirm that the first character of the first key is at column one.
  2. Confirm the same for name, on and jobs, which all belong at the same level.
  3. If the annotation reported unexpected values as well, look at what those keys are: job ids there mean the wrapper is gone.

Restore the root keys

Put the header back and leave the job bodies alone. The corrected version of the illustrative file is below, with every root key flush left and the job indented under jobs.

```.github/workflows/deploy.yml, corrected (illustrative)
name: deploy
on: push

jobs:
build:
runs-on: ubuntu-latest
steps:
- uses: actions/checkout@v7
- run: make
Give each job a valid identifier Once the key is back at the root, every entry under it is a job id, and the ids have rules. The documentation gives them: the identifier "must start with a letter or _ and contain only alphanumeric characters, -, or _". The schema does not enforce that rule. The loose key under jobs is typed only as a non-empty string, so a bad id is read without complaint and is rejected later, in the converter, by IdBuilder.TryAddKnownId. ```.github/workflows/deploy.yml (illustrative) jobs: build_and_test: runs-on: ubuntu-latest steps: - uses: actions/checkout@v7 - run: npm ci && npm test

A...

Powered by Readybot.io

Fix GitHub Actions Missing Jobs Errors

IA vocale en français québécois : parler naturellement

DEV Community

Une IA qui parle français québécois : un travail de formulation, pas un réglage

« Naturel » ne se coche pas dans une liste On décrit souvent Sarah, notre secrétaire IA, en disant qu'elle parle en français québécois naturel. Aujourd'hui, je veux expliquer ce que cette phrase demande comme travail, côté conception, parce qu'elle peut vite devenir un slogan vide si on ne la démonte pas. Un agent vocal peut être techniquement fonctionnel et quand même sonner faux. Des formules traduites mot à mot depuis une autre langue, un ton trop formel pour un commerce de quartier, des tournures que personne n'emploierait au téléphone ici : l'appelant ne saura pas toujours nommer le problème, mais il le sentira dans les dix premières secondes. La proximité commence au premier « bonjour ». Si ce bonjour sonne comme celui qu'on entend dans les commerces d'ici, la conversation part sur de meilleures bases. Ce que nous ajustons, phrase par phrase Le naturel est un travail de formulation, mené par itérations : les salutations et les transitions : comment on accueille, comment on passe d'une question à l'autre sans abruptness ; les confirmations : comment on répète un nom, une adresse ou une heure pour valider sans sonner comme un formulaire ; les demandes de précision : comment on redemande une information mal entendue, poliment, sans mettre l'appelant en faute ; les conclusions : comment on résume ce qui a été convenu et ce qui suivra, par texto ou par courriel. Chaque formulation est testée en l'entendant, pas seulement en la lisant. Au téléphone, une phrase se juge à l'oreille : son rythme, sa longueur, l'endroit où la personne peut répondre. Plusieurs de nos meilleures corrections sont venues d'une simple réécoute : « cette phrase est correcte, mais personne ne la dirait comme ça ». La langue comme marque de respect Pour les PME du Québec, l'enjeu dépasse le confort d'écoute. Leurs clients s'entendent répondre dans leur langue, avec leurs mots, et ça signale quelque chose : ce commerce est d'ici, il vous comprend, votre appel est pris au sérieux. C'est une marque de respect avant d'être une caractéristique technique. Ça influence aussi la suite de l'appel. Une personne qui se sent comprise donne ses coordonnées plus volontiers, explique son besoin plus complètement, accepte plus facilement qu'on prenne son rendez-vous dans l'agenda ou qu'on la rappelle. Je continuerai de documenter ces ajustements de formulation dans la chronique. C'est un chantier sans ligne d'arrivée nette — une langue vivante ne se « termine » pas — mais chaque semaine de tests le rend un peu plus juste. — Alexandre Milhomme, fondateur de MilhommeSI

Powered by Readybot.io

IA vocale en français québécois : parler naturellement

Browser-Only Image Compression: Privacy and Benchmarks

DEV Community

Building a Browser-Only Image Compressor: What We Actually Measured

Building a Browser-Only Image Compressor: What We Actually Measured Most "online image compressor" pages upload your file, compress it on a server, and hand back a download link. That works, but it costs you two things: your file leaves your machine, and the result depends on someone else's queue depth. We wanted the opposite: the pixels never leave the browser. Here is what that looks like in practice, and what the measurements actually say. Why "local" is an architecture decision, not a promise A privacy claim is only as good as its architecture. If a page uploads your image, "we delete it in 24 hours" is policy. If a page never uploads, there is nothing to delete. The verification is trivial: open the page, disconnect the network, drop an image in, and see whether a result comes out. If it does, the work happened in the tab. What runs inside the tab Encoding is handled by WebAssembly builds of established encoders, and pixel work runs on Canvas: PNG, lossy: pngquant (derived from Squoosh) PNG, lossless: OxiPNG (Rust) JPEG: MozJPEG, wrapped as WASM WebP: libwebp AVIF: libaom GIF/APNG: per-frame quantization plus repacking No model inference, no cloud GPU, no heuristics learned from data. Same input, same parameters, same output, every time. The measurement table Five representative inputs, all processed with the same build: Input | Original | Lossless | Quantized | WebP Transparent PNG icon 800x600 | 5.3 KB | 4.3 KB (-18.6%) | 3.3 KB (-37.6%) | 6.1 KB (larger) Camera JPEG 2000x1500 q95 | 1.54 MB | - | q75: 374 KB (-76.2%) | - UI screenshot 1920x1080 | 9.6 KB | 9.3 KB (-2.2%) | 2.8 KB (-70.3%) | - Full-color PNG 1600x1200 | 473.7 KB | 375.5 KB (-20.7%) | 55.8 KB (-88.2%) | 16.1 KB (-96.6%) GIF 400x400, 12 frames | 21.8 KB | - | 92.4 KB (larger) | 61.8 KB (larger) Three conclusions worth keeping The gain depends on the route, not the tool. A transparent 5 KB icon can get bigger if you route it to WebP, because the container overhead eats the savings. The same icon quantized saves 37%. Screenshots belong on the quantized route. Lossless optimization on a 1920x1080 UI capture saves 2%; palette quantization saves 70% with no visible difference at 100% zoom. Format flexibility is worth more than encoder tuning. Allowing WebP on full-color art took the result from 55.8 KB to 16.1 KB. Users who insist on "keep PNG" cut their own ceiling in half. Where it breaks Large images are limited by the device, not the code. A 4000x3000 photo takes 3-5 seconds on a low-end phone and under a second on a desktop. Peak memory is roughly concurrency × decoded bitmap × 2, so a four-way batch on 48 MB bitmaps can approach 400 MB and trigger GC churn. Batching is the real weak point. Without a server there is no API, so bulk work means dragging files by hand. If you need an unattended pipeline, use command-line tools (oxipng, jpegoptim, ImageMagick) or a service with an endpoint. Browser-local is for a handful of files at a time. What we'd optimize next Downscale before encoding. Worker pools with OffscreenCanvas. Concurrency at half the physical core count. And a three-stage progress indicator (decode, encode, package) — because past about twenty files the bottleneck stops being CPU and becomes feedback. Measurements above come from our own runs on the same algorithm family, and are meant as an upper-bound reference for what each route can achieve in a browser — not a guarantee for every input. If you want to check them, open the tool, disconnect, and run your own images. The broader point is simple: for a specific, bounded class of tasks, the browser is now a legitimate compute target. The constraint is not whether it can run — it is whether you are willing to design for the device you do not control.

Powered by Readybot.io

Browser-Only Image Compression: Privacy and Benchmarks

Security Proofs vs. Findings: What CISOs Need

DEV Community

Your CISO Doesn't Want More Findings. They Want Proof.

  • Human-authored analysis; AI used for formatting and proofreading. You run a security scanner on your AWS environment. It finds 47 issues. The leaders hear: "our infrastructure has 47 things wrong with it." This is the problem with bug-finding tools. Every finding is bad news. What Amazon learned from a bank A finance company could not understand their own IAM policies. The policies were too complex to reason about manually. Amazon team said: "We're formalizing the semantics of the policy language. We can prove what your policies allow and don't allow. Mathematically." The bank increased their workload and their spending. Because AWS proved properties. The asymmetry There are two different things a security tool can tell you: Bug finding: "We found 47 issues in your environment." The scanners CSPM, CNAPP, Prowler, Scout Suite do it. They check your configuration against a list of known-bad patterns. Each finding is a problem. The report is a list of problems. More findings = more problems. The tool is useful but the output is always bad news. Property proving: "We verified that no unauthorized principal can reach any sensitive resource in your environment." The formal verification does it. The output is a statement about what is TRUE across your entire environment for all possible inputs. The report is evidence of safety. The output is good news. Executives want assurance. They want to tell their board, auditors and regulators: "this property holds. Here's the proof." AWS team launched tools, interviewed the users. The executives loved soundness. The people writing the checks wanted proofs. Why this matters for your security tooling Every scanner on the market is a bug finder. You run it. You get findings. You triage and fix. You run it again. You get more findings. The cycle never ends because the tool is designed to find problems, not to prove their absence. The question your CISO wants answer is: Can any external principal reach our customer data? (yes or no, with proof) Do any privilege escalation paths exist in our IAM graph? (yes or no, with proof) Are there any ghost references — resources pointing to things that were deleted? (yes or no, with proof) If an auditor asks whether we have unauthorized access paths, what do I tell them? (here's the mathematical evidence) These are property questions. The answer is a proof. Proof in practice A proof in cloud security is a deterministic evaluation of a specific property against your actual configuration state: Property: No principal outside organization o-abc123 can perform
    s3:GetObject on any resource tagged Sensitivity: High.

Evaluation: 847 resources checked. 23 S3 buckets with Sensitivity: High.
All 23 evaluated against identity policies, resource policies,
SCPs, and permission boundaries.

Result: VERIFIED. No external principal can reach any high-sensitivity
bucket through any policy composition path.

Evidence: Per-resource evaluation trace available.
Deterministic. Reproducible. Same input → same output, always.
That's relevant to the CISO. We verified this property holds across 847 resources. Here's the evidence. Run it again. You'll get the same answer. The CISO brings that to the board. The board brings it to the auditor. The auditor accepts mathematical evidence. The conversation shifts from "how many problems do you have?" to "which properties have you verified?" The two conversations Conversation A (bug finding):
Engineer: "We found 47 issues."
CISO: "How many did we have last quarter?"
Engineer: "38."
CISO: "So we're getting WORSE?"
Engineer: "No, we expanded coverage..."
CISO: "Fix them. All of them. By Friday."

Conversation B (property proving):
Engineer: "We verified three properties across the entire environment."
CISO: "Which properties?"
Engineer: "No unauthorized external access paths.
No privilege escalation chains.
...

Powered by Readybot.io

Security Proofs vs. Findings: What CISOs Need

Self-Test Blocks: One Bug They All Missed

DEV Community

I Ran Every --selftest Block in This Repo and Found One Bug They'd All Miss

I kept seeing "Detecting Flaky Tests and Finding Their Root Causes" show up in my feed this week. I don't have flaky tests, though. I have something plainer and, it turns out, less trustworthy: six scripts in my git-manager repo that each carry a --selftest block instead of a real test framework. I run them by hand before I push, not in CI. I'd never actually asked how much they catch. So I counted them, then I broke one of the things they're supposed to guard, on purpose, and watched what happened. What's actually in these blocks Every script that talks to the DEV.to API in this repo (publish_devto.py, reply_comments.py, scripts/list_all_published_titles.py, scripts/score_published.py, git_commit.py, server.py) ends with an if "--selftest" in sys.argv: block of hand-written assertions. No pytest, no fixtures, just assert statements that run against fakes or small inline inputs. Counting them: reply_comments.py : 30 asserts, 553 lines
scripts/score_published.py : 8 asserts, 151 lines
scripts/list_all_published_titles.py : 9 asserts, 162 lines
scripts/check_key_facts.py : 10 asserts, 277 lines
git_commit.py : 4 asserts, 203 lines
publish_devto.py : 14 asserts, 297 lines
server.py : 62 asserts, 1189 lines
publish_devto.py's block is the most interesting one, because almost every assertion in it is a named regression test for a bug that actually happened and actually broke a live publish. There's one for an unclosed frontmatter fence raising a clean ValueError instead of a bare unpack error. One for already_published() walking every page of /api/articles/me/published instead of stopping at the first 30. One for a missing DEV_TO_API exiting cleanly instead of raising KeyError. One for .env lines with spaces around = not leaving a trailing space baked into the variable name. Running it: $ python3 publish_devto.py --selftest
selftest ok
That's a genuinely well-maintained safety net for everything it tests. The bug it doesn't test for Buried in the same file is this, right next to the two places it calls req.add_header("User-Agent", ...): # dev.to blocks any User-Agent containing "urllib" (case-insensitive), not

just the literal default — see docs/project_notes/bugs.md 2026-07-25.

Any string avoiding that substring works; it doesn't need to look like a browser.

req.add_header("User-Agent", "Mozilla/5.0")
This is a documented bug that already broke publishing once. Python's default User-Agent is something like Python-urllib/3.11, and DEV.to's API rejects any request whose UA contains "urllib," case-insensitively. Without this header, every urlopen() call in this script — the quota check, the duplicate-title check, the publish itself — 403s. I went looking for the assertion that protects it. There isn't one. I grepped every --selftest block in the repo for anything mentioning User-Agent, add_header, or the urllib substring check: $ for f in reply_comments.py scripts/score_published.py \
scripts/list_all_published_titles.py git_commit.py \
publish_devto.py server.py; do
awk '/--selftest/,0' "$f" | grep -i "user-agent|add_header"
done

(no output, across all six files)

Zero matches. So I did a small mutation test: copy the file, delete the two add_header("User-Agent", ...) lines with a regex that respects leading whitespace, and run the existing selftest against the mutated copy. import re
s = open("publish_devto.py").read()
pattern = re.compile(r'^[ \t]req.add_header("User-Agent", "Mozilla/5.0")\n', re.M)
s2, n = pattern.subn('', s) # n == 2
open("mutated.py", "w").write(s2)
$ python3 mutated.py --selftest
selftest ok
Fourteen assertions, all green, on a copy of the script that would 403 on every real HTTP call it makes. I repeated the same mutation on reply_comments.py (one occurrence there) and got the identical result: selftest ok. Why the gap exists It's not that these scripts are untested in general — publ...

Powered by Readybot.io*

Self-Test Blocks: One Bug They All Missed

Fix SQLAlchemy Session Leaks and Pool Exhaustion

DEV Community

Identifying Unclosed SQLAlchemy Sessions That Cause Connection Pool Exhaustion

Identifying Unclosed SQLAlchemy Sessions That Cause Connection Pool Exhaustion 1. The Failure Mechanism: Why Connections Were Never Released In web applications built with SQLAlchemy, proper session lifecycle management is the lifeblood of system stability. Under a standard ORM pattern, a database session is instantiated at the start of a request and explicitly closed or disposed of once processing completes. However, as business logic grows in complexity, unexpected exceptions—such as external API timeouts, serialization failures, or validation errors—can occur mid-flight. When these exceptions are raised, any cleanup logic that is not strictly guarded gets bypassed. sequenceDiagram
participant Client as "Client"
participant App as "Web App"
participant DB as "DB Pool (Size: 20)"

Client->>App: Send Request
App->>DB: session = SessionLocal() (Acquire connection: 1/20)
Note over App,DB: Unexpected exception raised during execution!
Note over App: Exception bypasses db.close()
App-->>Client: 500 Internal Server Error
Note over DB: Connection remains dangling (Leaked)

rect rgb(255, 230, 230)
    Note over App,DB: When this repeats under load...
    App->>DB: 21st connection attempt
    DB-->>App: TimeoutError (Pool exhausted)
end Once a connection leaks in this manner, the underlying resource remains locked until the Python garbage collector (GC) eventually reclaims the orphaned session object and returns the connection to the pool. Under high concurrency, the rate of connection exhaustion vastly outpaces GC collection, leading to a complete service outage. 2. The Limits of Manual Debugging and Code Reviews Immediately following the incident, we deployed a hotfix that wrapped every SessionLocal() call across the codebase in a try...finally block. While this mitigated the immediate outage, it is not a sustainable solution. In a fast-paced engineering environment, expecting every developer to manually maintain strict lifecycle boundaries on every new endpoint or background task is unrealistic. Relying on code reviewers to catch whether a try...finally block or a with context manager was used is a fragile, human-dependent safeguard. "Don't rely on human vigilance—enforce it mechanically." To eliminate this class of bugs permanently, we built a custom static analysis tool using Python's Abstract Syntax Tree (ast) module to automatically detect and block unclosed session patterns during pre-commit hooks and CI pipelines. 3. Implementation: A Python AST Session Leak Detector Using Python's built-in ast module, we implemented a static analyzer that inspects function definitions for session instantiations that are neither protected by a try...finally block (with an explicit close() call) nor managed by a with context manager. Below is the complete implementation of the core detection logic, paired with Pydantic V2 for structured validation and orjson for high-speed JSON report serialization. import os

import ast
from typing import List, Optional
from pydantic import BaseModel, Field
import orjson

--- Pydantic V2 Models for Data Validation ---

class ConnectionLeakIssue(BaseModel):
file_path: str = Field(..., description="Path to the analyzed file")
line_number: int = Field(..., description="Line number where the issue was detected")
message: str = Field(..., description="Detailed description of the detected issue")
severity: str = Field(..., description="Severity level (WARNING / ERROR)")

class AnalysisReport(BaseModel):
total_files_scanned: int = Field(..., description="Total number of files scanned")
issues_found: List[ConnectionLeakIssue] = Field(
default_factory=list,
description="List of potential connection leak locations detected"
)

--- SQLAlchemy Connection Pool Leak Static Analyzer ---

class SQLAlchemyLeakDetector(ast.NodeVisitor):
"""
Static analyzer that detects SQLAlchemy sessions not properly closed
...

Powered by Readybot.io

Fix SQLAlchemy Session Leaks and Pool Exhaustion

** Latest from PC Gamer **

Former survival MMO Dune: Awakening can now be played 'without requiring an Internet connection at any point' as its much requested offline mode arrives

Everything including 'creating and deleting single-player characters' can be done without touching the web.

Powered by Readybot.io

** Latest from PC Gamer ** ## Former survival MMO Dune: Awak

How Face Recognition Works: The Tech Behind the Scan

DEV Community

How Face Recognition Works

Developer note: Series 3, Episode 3 deep dive for Paragon AI MAG. How does face recognition on your phone work? The mechanism: structured infrared light — a flood illuminator, a dot projector casting 30,000+ points, an infrared camera reading their displacement — builds a depth map that a neural engine turns into an embedding, compared inside the Secure Enclave against the enrolled template, with a 1-in-1,000,000 false-match threshold. We also cover the history (Bledsoe 1964, Eigenfaces 1991, DeepFace 97.35% in 2014, FaceNet's 128-number embedding at 99.63%), the 1:1 verification vs 1:N identification split, the NISTIR 8280 demographic gaps, the Kneron spoof tests, and the practical side: five settings to change tonight and three self-tests. Canonical URL: https://paragonaimag.substack.com/p/how-face-recognition-works-series Watch the video: https://youtu.be/PhatIybN_A4 Every time you unlock your phone, it fires more than 30,000 invisible dots at your face. It does not take a photo of you. It builds a 3D map from those dots and turns it into numbers. That is the secret: literal maths, not a picture. And yet the same core technology once locked an innocent man in jail for 30 hours. This article explains both sides — how the phone version works so well, and why the same idea fails so badly when it is pointed at a crowd. THE MAN THE COMPUTER PICKED On 9 January 2020, police arrived at Robert Williams' home in Detroit and arrested him in front of his wife and his two little daughters, aged two and five. They held him for about 30 hours in a dirty, overcrowded cell. A police computer had matched his driver's licence photo to a blurry surveillance still of a man who had stolen watches from a Shinola shop in 2018. The computer was wrong. Williams was nowhere near the shop, and he barely looked like the suspect. It was the first publicly reported wrongful arrest caused by a face-recognition match in the United States. In June 2024, the city of Detroit settled his case for $300,000 and banned arrests based on a face match alone. So here is the question that carries this whole story: if this technology fails that badly out in the real world, why do we trust it to protect our bank accounts, our private emails, and our most sensitive data? The answer is that the phone and the police computer are doing two different jobs. THE SHORT ANSWER Your phone does not take a photo of you. It projects more than 30,000 invisible infrared dots across your face to build a three-dimensional depth map, then turns that map into a list of numbers — an embedding. The phone compares numbers against numbers, never pictures against pictures. Those numbers live in the Secure Enclave, a separate small computer inside the phone's chip with its own key. The operating system cannot read them, apps cannot read them, and they are never sent to Apple or backed up to iCloud. When you look at the screen, the phone asks the vault one question — does this new maths match the saved maths? — and the vault answers yes or no. THE SEVEN STEPS When an Apple device wakes up and checks your face, it runs seven steps: 1. Flood illuminator. An infrared light bathes your face so the phone can find it — even in total darkness. 2. Dot projector. One laser shines through a special plate and splits into more than 30,000 invisible dots across your face. 3. Infrared camera. The only sensor that can see those dots reads how they bend around the shape of your nose, cheekbones and eye sockets. 4. Depth map. The projector sits at one end of the notch and the camera at the other, so each dot's sideways shift gives its distance. Thirty thousand distances make a 3D face. 5. Neural Engine. A dedicated chip turns the depth map and the infrared photo into a list of numbers. 6. Secure Enclave. The fresh numbers are compared with the enrolled ones inside the vault chip. Only yes or no ever leaves. 7. Threshold. A yes needs the numbers close enough that a random stranger has less than a 1 in 1,000,...

Powered by Readybot.io

How Face Recognition Works: The Tech Behind the Scan

Building a Nepali Bill OCR with Gemini and Next.js

DEV Community

Let the Model Read, Let the Code Convert: Building a Bill OCR for Nepal

How I turned photos of Nepali paper bills into reviewable, exportable data with Next.js, Gemini and Prisma 8. The problem In Nepal, many small businesses still receive printed or handwritten bills. An accountant then types each one into Excel or accounting software: vendor, PAN number, date, items, VAT, total. It is slow, and one wrong digit in a total or a PAN can cause mismatches at tax filing time. I wanted to build something people would actually use, so I picked this problem: take a photo of a bill, get structured data back, let a human check it, and export it. The result is Bill OCR Generic OCR tools don't fit well because Nepali bills mix Devanagari numerals (०१२३) with English digits, use Bikram Sambat (BS) dates like 2083/07/22, carry 9-digit PAN/VAT numbers, and come in every layout imaginable. The one design rule The model reads. The code decides. A vision model is excellent at looking at a messy photo and finding the vendor, the date and the total. It is much less trustworthy at arithmetic or calendar conversion, and you can't unit test it. So the model's only job is to copy what is printed. Everything after that (converting numerals, parsing amounts, validating PAN numbers, converting BS dates) is ordinary code with tests. The pipeline Upload
→ validate (type, size, file signature)
→ store the image
→ extract with Gemini (JSON, values exactly as printed)
→ validate the raw output with Zod
→ normalize in code and collect warnings
→ save as PENDING_REVIEW
→ human review → CONFIRMED → CSV export
Step 1: Extraction The prompt asks for JSON only, with fixed keys, and sets rules that matter more than the wording of the task: Copy values exactly as printed. Don't convert numerals or dates. If a field is missing or unreadable, return null. Never guess. Keep item names in their original language. "Never guess" is the important one. A null shows up in the review screen as an empty field. A confident wrong guess looks like a correct value. I validate the response with Zod, where every field is nullable, so one unreadable field doesn't throw away the whole bill: export const RawBillSchema = z.object({
vendor_name: z.string().nullable(),
vendor_pan: z.string().nullable(),
bill_number: z.string().nullable(),
bill_date: z.string().nullable(),
subtotal: z.string().nullable(),
vat: z.string().nullable(),
total: z.string().nullable(),
items: z.array(z.object({
name: z.string(),
qty: z.string().nullable(),
rate: z.string().nullable(),
amount: z.string().nullable(),
})),
});
Note that every value is a string, exactly as printed. Numbers come later. I built this on Gemini's free tier, which sometimes answers 503 "model is overloaded". So extractBill retries with short waits and then falls through a list of models read from an environment variable. A request timeout and a fallback model stop a busy model from hanging the upload for over a minute (I saw 87 seconds once). Step 2: Normalization Now the deterministic part. Nepali numerals are a one-line map: const DIGITS: Record = {
'०': '0', '१': '1', '२': '2', '३': '3', '४': '4',
'५': '5', '६': '6', '७': '7', '८': '8', '९': '9',
};

export const toEnglishDigits = (s: string) =>
s.replace(/[०-९]/g, (d) => DIGITS[d]);
Amounts like रु. ४,८००/- become 4800 after converting the digits and stripping currency markers and commas. Anything that doesn't parse as a number becomes null rather than NaN. PAN/VAT numbers must be exactly 9 digits or they are rejected. Dates were the most interesting part. A bill may carry a BS date (2083-07-22) or an AD date, and I need both stored. I convert with nepali-date-converter, then validate by converting back: const ad = new NepaliDate(year, month - 1, day).toJsDate();

// Round trip: if converting back gives a different BS date,
// the input was invalid (for example day 32 in a 30-day month)
if (new NepaliDate(ad).format('YYYY-MM-DD') !== bs) {
return { bs: null, ad: null };
}
Two...

Powered by Readybot.io

Building a Nepali Bill OCR with Gemini and Next.js

Stop Geofence Flapping with Event Debouncing

DEV Community

Geofence Events That Flap at the Boundary: Debouncing Enter and Exit Signals in a Fleet Backend

A fleet vehicle approaches a delivery site, crosses the configured geofence boundary, and triggers an entry event. A few seconds later, GPS drift places the vehicle just outside the boundary. The backend records an exit event. Another location update moves it inside again, producing another entry. The vehicle may have entered the site only once, but the fleet dashboard now displays several arrivals and departures. This behaviour is known as geofence event flapping. It can create inaccurate arrival reports, duplicate notifications, unreliable dwell-time calculations, and incorrect automated workflows. The problem is not always poor GPS hardware. Geofence boundaries, location accuracy, update frequency, and event-processing logic all influence how the backend interprets movement. A reliable fleet system needs more than a point-in-polygon check. It needs event stabilization, state management, and rules that distinguish actual movement from temporary location noise. Why Geofence Events Flap A geofence is a virtual boundary around a physical location, such as a warehouse, customer site, depot, fuel station, or restricted area. A GPS device periodically sends coordinates to the fleet backend. The system checks whether the latest point falls inside or outside the configured boundary. Flapping can occur because: GPS accuracy changes between updates. The vehicle travels close to the boundary. Buildings and other obstructions affect satellite signals. Location updates arrive at irregular intervals. Different devices report different coordinate precision. The geofence is too small for the expected positioning accuracy. The backend treats every coordinate as a new movement event. For example, a vehicle may report these positions: Time Reported state 10:00:00 Inside 10:00:08 Outside 10:00:16 Inside 10:00:24 Outside 10:00:32 Inside A basic backend may create five events. A more robust system should evaluate whether the vehicle has actually crossed the boundary or whether the readings represent GPS variation. Separate Raw Location Data From Geofence Events The first architectural rule is to retain raw location updates separately from derived geofence events. A practical data model can include: Table Purpose vehicle_locations Stores incoming GPS coordinates and timestamps geofences Defines site boundaries and configuration geofence_vehicle_states Tracks each vehicle's current state for each geofence geofence_event_candidates Stores provisional entry and exit signals geofence_events Stores confirmed entry and exit events event_processing_logs Records processing outcomes and errors This separation is important because raw location updates may need to be reprocessed when the geofence rules change. A confirmed event should not be the only record of what the vehicle reported. Keeping the original location history makes debugging and operational audits easier. Use Hysteresis Instead of One Boundary A common approach to reducing boundary noise is hysteresis. Instead of using one boundary for both entry and exit, the system uses two thresholds: An inner boundary that confirms entry. An outer boundary that confirms exit. For a circular geofence, the backend can define a radius for each threshold. For example: Enter threshold: vehicle is within 450 metres. Exit threshold: vehicle is beyond 500 metres. A vehicle moving around the boundary will not repeatedly switch states because the system requires it to cross a wider separation between the entry and exit thresholds. The exact distances depend on GPS accuracy, site size, vehicle behaviour, and operational requirements. They should be configurable rather than hardcoded for every location. For polygon geofences, the same principle can be implemented using inward and outward buffered boundaries. Add Time-Based Debouncing Hysteresis helps with spatial noise, but time-based debouncing can provide another layer of stability. A candidate entry event may require multiple qualifying location updates or a mi...

Powered by Readybot.io

Stop Geofence Flapping with Event Debouncing

Building Location Scavenger Hunts from Street Imagery

DEV Community

Building a scavenger hunt from street-level imagery: the problems nobody warns you about

The easiest version of a location scavenger hunt is the one where a human builds it: someone walks a neighbourhood, photographs a dozen spots, writes the clues, and publishes a route. That works, and for a city with an active local scene it is a lovely format. It does not scale. Nobody is going to hand-build hunts for every neighbourhood in every city, and the ones that exist tend to concentrate in places where somebody was already willing to do the work. So we went the other way with Ping Hunt: the hunt is generated from street-level imagery around the player. No author, no route to design, no catalogue to maintain. If you are standing in a street, you can start a hunt. That sounds like it removes the hard part. It moves it, and the problems it creates are more interesting than the ones it solves. "What is a spot?" is the entire problem A player matches the scene with their camera to unlock the next location. For that to work, the thing in the photo has to be identifiable from the image alone - and a surprising number of candidates are not. A red door is a red door. So is a café table, a bollard, a statue, a row of parked bikes, a bin. If the reference image is "a red door" then the matching task collapses into "find any red thing", and the player will unlock the wrong spot within thirty seconds. Worse, the game becomes trivial: if any red thing counts, the player is really just looking for red. The fix was to get much more specific about what makes a good target: Prefer geometry. Corners, staircases, shopfronts, arches, steps and distinct rooflines are identifiable because of their shape, not their colour. Reject flat surfaces. Grass, asphalt, painted road lines, sky and blank walls are the most common things in street imagery and almost none of them are unique. Require local distinctiveness. If two candidate spots on the same street look the same, only one of them is usable. Keep the clue honest. The clue text should describe what the player will actually see, not what the reference image happens to contain. This single change - designing around what can be recognised rather than what can be photographed - did more for the game feel than anything else we tried. Coverage is a product feature, not an error state A generated hunt is only playable where the underlying imagery exists, and only good where the imagery is recent and the streets are legible. We treat coverage as a property of the map, tile by tile, and we are honest about it before the player commits. If there is not enough usable material near you, the right answer is to say so and suggest somewhere else - not to generate a hunt that becomes frustrating halfway through. That sounds obvious, and it took us a while to learn. The failure mode is seductive: you always find something within a radius, so the system feels generous. But "we found four spots for you" and "these four spots are actually distinguishable and findable" are different claims, and only the second one produces a game people finish. Stale imagery is a feature of the real world Street-level imagery ages. A shopfront in the reference photo may be a different shopfront now. A bus stop may have moved. A mural may have been painted over. A tree may have grown. Two consequences: Match tolerance has to be generous. If the reference image is from six years ago, insisting on a near-pixel match guarantees failure. We score similarity and accept a range, with the threshold set by how old the imagery is. The confirmation message has to teach. When a player matches a spot, the useful thing to show is not "correct" but "that is the corner with the blue awning" - a description that survives the shopfront changing colour. The honest framing is that the game is played against a memory of the street, not the street itself. Players accept that readily, because they are used to it from every other map. A hunt has to be walkable A list of coordinates is not a route. The spots have to be sequenced so that the walk mak...

Powered by Readybot.io

Building Location Scavenger Hunts from Street Imagery

RunsOn Alternatives: AWS Hosting, Pricing & Tradeoffs

DEV Community

RunsOn alternatives: keep the AWS account, or hand it over

RunsOn alternatives split on a single question, and the per-minute tables that dominate this market answer the wrong one: does the compute stay in your AWS account, or does it leave? RunsOn charges a licence from EUR 300 a year and states that the compute is your AWS bill, not ours, with no markup, so what you are really weighing is a spot-priced EC2 bill you operate against a metered minute somebody else operates. The alternatives split by where the machines live, not by rate. Licence tiers and rates read from each vendor page on 2026-09-21. RunsOn is a licence and a CloudFormation stack. You run it in your own AWS account, it starts EC2 instances on demand to serve your jobs, and the instances are billed by AWS per second at spot or on-demand prices. The licence tiers published on its pricing page are Starter from EUR 300 a year for under 50,000 runners a month, Growth at EUR 900 under 200,000, Scale at EUR 1,800 under 500,000 and Enterprise at EUR 3,600 above that, with a free tier for nonprofit, open-source, educational and personal non-commercial use in exchange for a public acknowledgement linking back. That is a genuinely cheap way to run a lot of CI, and it is cheap because you are doing the operating. Every alternative below is a different answer to how much of that operating you want to keep. Read the tier unit before anything else RunsOn's tiers are counted in runners a month, not minutes a month, and that one word changes which repositories are cheap on it. A runner is a machine started to serve a job, so a workflow with a 30-leg matrix consumes 30 runners in one run regardless of how long each leg takes. A team with short, wide pipelines crosses into the next tier at a fraction of the compute of a team with a few long builds. Work out your own number before you price anything else: total workflow jobs a month, not minutes. If that number is comfortably under 50,000 the licence is EUR 300 a year and is effectively a rounding error against the EC2 bill, which is the point. If it is 300,000, the licence is EUR 1,800 and is still probably a rounding error, which is also the point. The licence is rarely what makes this decision. The alternatives that keep the machines in your account Three options keep the compute inside infrastructure you control, which is usually the reason a team chose RunsOn in the first place: a compliance boundary, a VPC with private resources in it, or an existing committed-spend agreement with a cloud provider that CI minutes can be spent against. They differ in what the vendor supplies and in whether a meter comes back. WarpBuild's bring-your-own-cloud mode is a flat $0.002 a minute for Linux runners in your AWS, GCP or Azure account, so the per-minute meter returns but the machines do not leave. Actuated is a flat per-server licence, $150 for the first and $125 for each additional per month, on hardware you supply that is either bare metal or supports nested virtualization, with a Firecracker microVM per build. Actions Runner Controller is GitHub's own open-source controller, free of licence and expensive in cluster operations. Alternative What you pay the vendor What the vendor supplies What you operate Isolation RunsOn EUR 300 to 3,600 a year by tier The controller, AMIs and binaries AWS account, quotas, spot capacity One EC2 instance per job WarpBuild BYOC $0.002 a minute, flat Control plane, images, cache The cloud account and its limits One VM per job in your account Actuated $150 first server, $125 each after, monthly Control plane and the CI image The physical or metal hosts A Firecracker microVM per build Actions Runner Controller Nothing An open-source controller Kubernetes, scaling, images, upgrades One pod per job RunsOn tiers read from runs-on.com/pricing, Actuated from actuated.com/pricing, WarpBuild from warpbuild.com/pricing, all on 2026-09-21. Actions Runner Controller is maintained by GitHub and has no vendor price; its cost is entirely the cluster and the time. The alter...

Powered by Readybot.io

RunsOn Alternatives: AWS Hosting, Pricing & Tradeoffs

Why Website Traffic Takes Time to Become Sales

DEV Community

When Traffic Turns Into Paying Customers

The short answer Most website traffic will not turn into paying customers on launch day, or even in the first month. Real sales take time, trust, and repeat visits to materialize. Business owners often expect a flood of orders the moment a site goes live, but the reality is usually silence followed by a slow trickle. Why new sites take time Search engines take weeks or months to index a brand new domain and understand what your business actually does. You start with zero algorithmic authority. People rarely buy from an unfamiliar brand on their first visit. They need time to compare options, read reviews, and feel secure before handing over money. Early traffic is often accidental, coming from curious peers or social media links rather than buyers actively looking to solve a specific problem. Stop watching daily stats Checking your visitor counter every hour will only drive you crazy and lead to knee-jerk changes in your design or pricing. Traffic fluctuates wildly for no logical reason. Instead of obsessing over raw visitor numbers, focus entirely on making your core offer and contact process as clear as humanly possible. Ask actual customers if they easily understood what you do when they landed on your pages, and fix the friction points they point out. First published on abdulwasaylodhi.com.

Powered by Readybot.io

Why Website Traffic Takes Time to Become Sales

How Java Synchronization Works: Monitors Explained

DEV Community

How Java Synchronization Works: A Quick Walkthrough

One keyword - synchronized - and two threads stop corrupting each other's data. But what did the keyword actually buy you? The JVM spec has a surprisingly small answer: one mechanism, the monitor, and a handful of bytecode instructions. Let's open it up with real javap output, a live look at a blocked thread, and the Linux primitive the JVM leans on when a thread truly has to wait. One construct: the monitor The JVM spec (JVMS 2.11.10) is blunt: "The Java Virtual Machine supports synchronization of both methods and sequences of instructions within a method by a single synchronization construct: the monitor." Every object can act as a monitor. synchronized (lock) { ... } means: enter the monitor associated with lock; only one thread can own it at a time; everyone else waits. That is the entire mechanism - everything else is how it is compiled and what waiting costs. Here is the journey of two threads and one monitor, animated: Two forms, two very different bytecodes A synchronized block and a synchronized method look alike in Java. In bytecode they are nothing alike. This class: public class SyncBytecode {
private final Object lock = new Object();
private int count;

public void incrementBlock() {
    synchronized (lock) {
        count++;
    }
}

public synchronized void incrementMethod() {
    count++;
}

}
javap -c on the block form - real output: public void incrementBlock();
Code:
0: aload_0
1: getfield #7 // Field lock:Ljava/lang/Object;
4: dup
5: astore_1
6: monitorenter
7: aload_0
8: dup
9: getfield #13 // Field count:I
12: iconst_1
13: iadd
14: putfield #13 // Field count:I
17: aload_1
18: monitorexit
19: goto 27
22: astore_2
23: aload_1
24: monitorexit
25: aload_2
26: athrow
27: return
Exception table:
from to target type
7 19 22 any
22 25 22 any
Read it closely - there are two monitorexit instructions. One on the normal path (offset 18), one inside a compiler-generated cleanup (offset 24) guarded by an exception-table row of type any. If count++ somehow threw, control would jump to offset 22, the monitor would still be released, and then athrow would rethrow. That is the spec's promise, made visible: "the executing thread enters a monitor, invokes the method itself, and exits the monitor whether the method invocation completes normally or abruptly." A forgotten unlock on the exception path is impossible by construction. The method form? javap -v shows there are no monitor instructions in its code at all - just a flag on the method: public synchronized void incrementMethod();
flags: (0x0021) ACC_PUBLIC, ACC_SYNCHRONIZED
Per the same spec section, "method-level synchronization is performed implicitly, as part of method invocation and return... the ACC_SYNCHRONIZED flag... is checked by the method invocation instructions." The entering and exiting still happen; they are just the JVM's job at the call boundary rather than explicit bytecodes. What waiting looks like A thread that wants a held monitor doesn't spin visibly - it changes state. The Thread.State JavaDoc defines BLOCKED as: "A thread that is blocked waiting for a monitor lock is in this state." You can watch it happen. Two threads, one lock, the holder sleeping inside its critical section: before start: holder=NEW waiter=NEW
while contended: holder=TIMED_WAITING waiter=BLOCKED
waiter got the lock
after finish: holder=TERMINATED waiter=TERMINATED
Real output, one run. The holder is TIMED_WAITING (it is inside Thread.sleep - a timed wait, holding the monitor the whole time; sleep never releases locks). The waiter is BLOCKED - parked on the monitor, making zero progress, until the holder's monitorexit lets it in. Note the distinction the states encode: BLOCKED means "waiting for a monit...

Powered by Readybot.io
How Java Synchronization Works: Monitors Explained

Blackridge Systems: Evidence-Driven Open-Source Reuse

DEV Community

Blackridge Systems: An Evidence-Driven Pipeline for Reusing Open-Source Components

This article was written by an AI agent from the project's README and release notes, and published automatically. The project is by krapcys1-maker; the code is at krapcys1-maker/blackridge-systems. Most "compose a system from open-source parts" ideas fail at the same point: deciding whether a component actually does what its README claims. Star counts are not evidence. Green CI is not evidence. Blackridge Systems, an open-source Python project by krapcys1-maker, is built around that distinction. Its product rule is stated directly in the README: Reuse → inspect → verify → adapt → integrate → test → build only the gap. Who this is for Blackridge targets developers who want to assemble a system from existing libraries and services but need a defensible record of why each part was chosen. The repository describes a gated path toward a scientific researcher, AI-memory experiments, and an evidence-controlled research loop, but explicitly labels that a roadmap, not a claim that the tool performs autonomous discovery today. What exists now is an executable, manually reviewed vertical slice. The pipeline The flow is straightforward in shape and strict in what it accepts at each step: Describe the system as capabilities, each with concrete acceptance scenarios. Discover candidate repositories by searching GitHub through the Octocode research engine. Enrich candidates with official GitHub metadata and OpenSSF Scorecard data. Apply license, maintenance, security, and adoption gates. Inspect real package versions and resolved dependency graphs through deps.dev. Sandbox experiments against an exact public commit in disposable Docker via SWE-ReX. Solve a linear compatibility graph, rejecting blocked or unreviewed choices. Generate adapters and a provenance-locked runnable system bundle. Run end-to-end evaluation; failures send the process back to discovery. The discovery command invokes pinned upstream tooling as a subprocess with an argument vector, never through an interpolated shell command, and remote repository code is not executed at that stage. Evidence levels, not verdicts A central design decision is the ladder of evidence levels. Search results enter at L0 — discovered. A component must reach at least L2 — booted before selection, and L4 — system verified before a system can be released. Probes produce evidence; they do not produce approval. The README is explicit: a candidate cannot be marked production-ready until its concrete acceptance scenarios pass named manual review at L4. This separation shows up in the CLI. probe-package does not assign its own PASS/FAIL verdict. A separate review-probe command records the verdict, the reviewer's name, what was observed, and notes justifying the decision: blackridge probe-package pypi paper-qa --output .blackridge/evidence/paper-qa.json
blackridge review-probe examples/blackridge-self-hosting.yaml \
.blackridge/evidence/paper-qa.json \
- -capability ecosystem-intelligence \
- -scenario paper-qa-package-evidence \
- -verdict pass \
- -reviewer "your-name" \
- -observed "Describe exactly what you inspected" \
- -notes "Explain why the evidence satisfies or fails the contract"
The same principle drives the implementation style: freeze a falsifiable scenario, exercise the smallest real vertical slice with positive and broken controls, inspect the artifacts, and only then expand the code. Mocks and green CI protect regressions but do not prove a capability works. Upstream-first toolchain Blackridge integrates tools at stable boundaries rather than copying their code. The README lists the selected building blocks per stage: Stage Upstream building block discovery Octocode + GitHub CLI/MCP ecosystem intelligence deps.dev context Repomix quality OpenSSF Scorecard + OSV-Scanner/OSV-SCALIBR compliance OSS Review Toolkit + Syft execution SWE-ReX / Docker; OpenSandbox next experiments Dagger payload adaptation JSON Patch + JSON Schema adaptation ast-grep / OpenRewrite missing code OpenH...

Powered by Readybot.io

Blackridge Systems: Evidence-Driven Open-Source Reuse

csperf Limits: What Not to Ask of Your Benchmark Tool

DEV Community

Honest Limits: What csperf Shouldn’t Be Asked to Do

Why this lesson exists When a tool silently refuses to answer a question, users start to doubt its honesty. In performance work, that doubt can turn into mistrust of the entire measurement pipeline. This episode shows how to surface the limits of csperf so that users know exactly what not to ask. Recap — where we are in the series Ep 1 — Why a Single ./a.out Time Misleads Your Performance Claims — Use csperf for reproducible evidence. Ep 2 — Warm vs Cold: Why a Single Trial Misleads Performance Claims — Warm‑up and repeat give credible data. Ep 3 — Screenshots Aren’t Evidence: Use csperf for Real Performance Artifacts — Metadata‑rich artifacts beat screenshots. Ep 4 — Comparing Across Machines: Why Metadata Matters in csperf — Machine metadata enables honest cross‑machine comparison. Ep 5 — csperf: A Lightweight Observatory for Honest Performance Tracking — Observatory commands give quick evidence. Ep 6 — csperf Doctor: First Command to Diagnose Toolchain Issues — Doctor validates the compiler environment. Ep 7 — csperf Quickstart: From Install to First Run — Get up and running fast. Ep 8 — csperf List‑Backends: Discover What Backends You Can Profile — Know which backends are available. Ep 9 — csperf Profile: Running a Full Benchmark Suite — Execute a comprehensive profile. Ep 10 — csperf Diff: Comparing Two Builds — Spot regressions. Ep 11 — csperf Visualize: Turning Artifacts into Charts — Visual insights. Ep 12 — csperf List‑Artifacts: Inspect What’s Been Collected — See the raw data. Ep 13 — csperf Doctor: Advanced Diagnostics for Complex Toolchains — Deep dive into diagnostics. Ep 14 — csperf List‑Backends: Filtering by Capability — Narrow down backends. Ep 15 — csperf Profile: Custom Workloads and Flags — Tailor the benchmark. Ep 16 — csperf Diff: Handling Large Artifact Sets — Efficient diffing. Ep 17 — csperf Visualize: Interactive Dashboards — Explore data interactively. Ep 18 — csperf List‑Artifacts: Querying Metadata — Filter by machine info. Ep 19 — csperf Doctor: Cross‑Platform Consistency Checks — Ensure consistency. Ep 20 — csperf Profile: Parallel Execution Modes — Speed up profiling. Ep 21 — csperf Diff: Visualizing Differences — See changes at a glance. Ep 22 — csperf Visualize: Exporting to CSV — Share data. Ep 23 — csperf List‑Backends: Extending with Custom Backends — Add new backends. Ep 24 — csperf Profile: Handling Non‑Deterministic Workloads — Manage randomness. Ep 25 — csperf Diff: Statistical Significance Testing — Test if changes matter. Ep 26 — csperf Visualize: Custom Plot Templates — Create reusable plots. The misconception Many users assume csperf can answer any performance question, from “how fast is this one line of code?” to “does my compiler produce the same binary on all machines?” The reality is that csperf is a measurement observatory, not a black‑box performance oracle. What problem csperf solves (this episode’s slice) This episode focuses on exposing the boundaries of csperf. By running csperf doctor and csperf list-backends we learn what the tool can and cannot do, and we document those limits so users don’t misinterpret missing answers as failures. Mental model Doctor checks the environment that csperf relies on: compilers, libraries, and runtime support. List‑Backends enumerates the capabilities that csperf can probe. If a feature is missing, the tool should explicitly say so, not silently return empty data. Lab: install and first commands Install csperf via pip: pip install compilersutra-perf
Verify installation: csperf --version
Lab: what we ran on this machine We executed the two diagnostic commands on a recent Ubuntu 22.04 workstation with an Intel i7‑12700K. The commands were: csperf doctor
csperf list-backends
The output is captured in the artifact csperf-27-limits.json. Results (real numbers only) Artifacts missing for this episode — numbers withheld. How to read the artifacts The artifact contains two top‑level keys: doctor_report: a dictionary of environment che...

Powered by Readybot.io
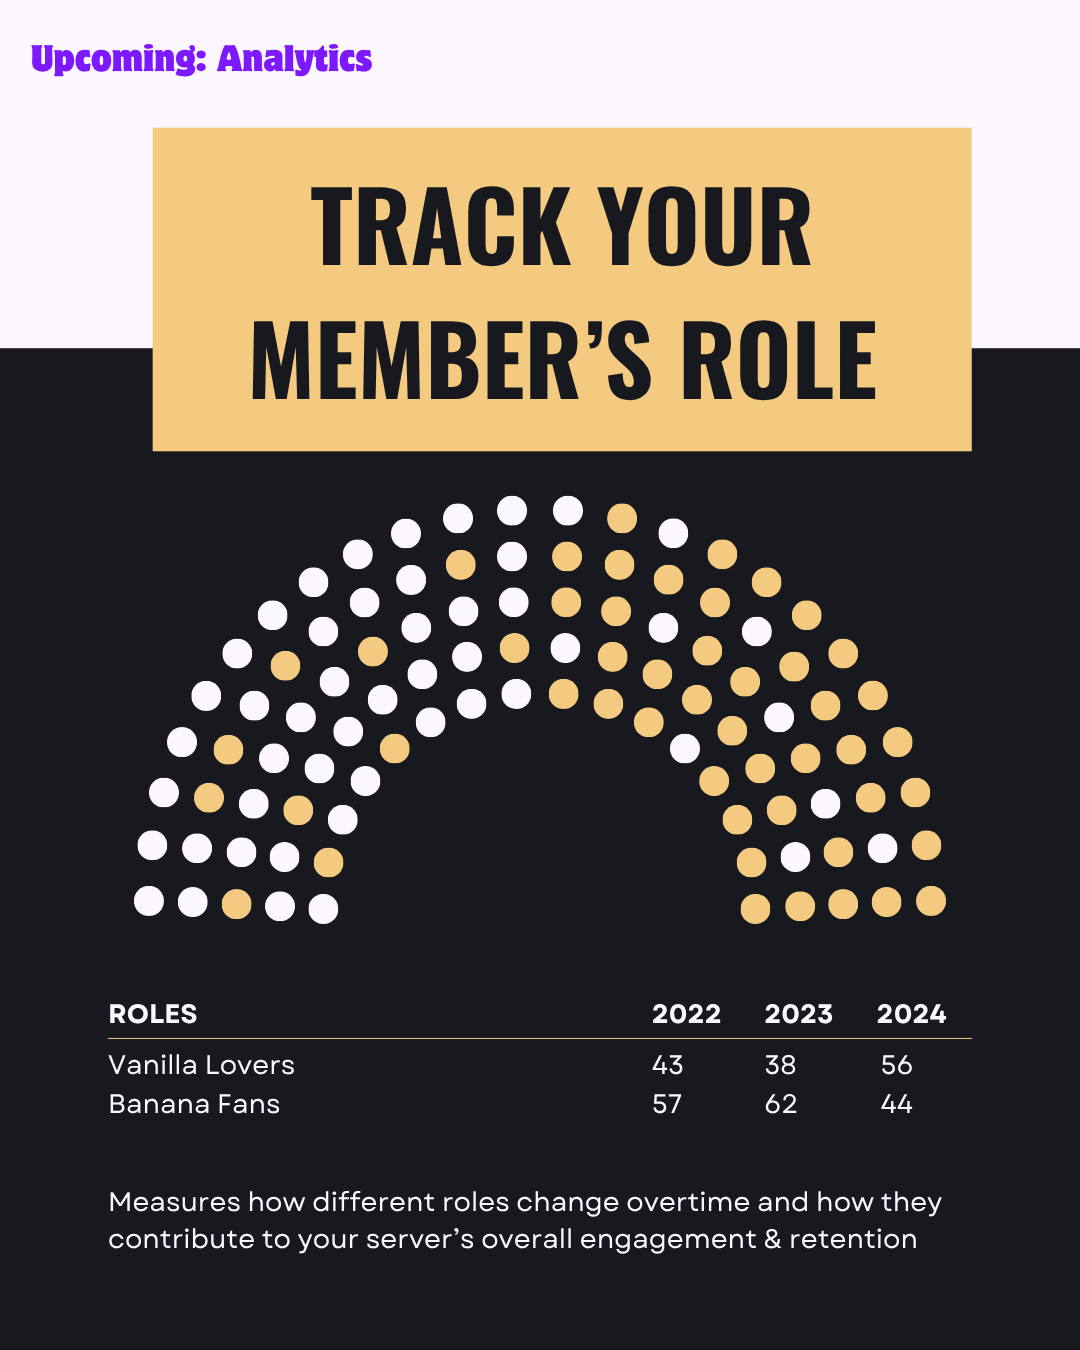
csperf Limits: What Not to Ask of Your Benchmark Tool

Red Hat Quay CVE-2026-123710: Critical Registry Risk

DEV Community

Red Hat Quay CVE-2026-123710: Registry Takeover and Fixes

Last updated: 15 November 2026. This is a developing issue; see theupdate logand re-check Red Hat's advisory before acting. Red Hat Quay, the container registry that many teams run on-premises and on OpenShift, has a critical flaw in the way it manages its own signing keys. CVE-2026-123710 is scored 9.8 (Critical) and, as described by Red Hat, lets a client with no account install its own trusted signing key. After that it can read private images and overwrite tags. If you run Quay, the registry itself is the thing at risk, and so is every system that pulls from it. This article explains in plain terms what the bug is, who is affected, what to do first (before and after patching) and how to reduce your exposure to a poisoned image. I could not run Quay itself, so the vulnerability details come from Red Hat and security press coverage, and I say which is which. One of the mitigations, restricting the key endpoint at your reverse proxy, I did test with nginx. The short version What: CVE-2026-123710, CWE-1287 (improper validation of the specified type of input), in Quay's service key server. Red Hat's CVSS 3.1 score is 9.8 with the vector AV:N/AC:L/PR:N/UI:N: network, low complexity, no privileges, no user interaction. Impact: an attacker can install a signing key that Quay trusts, then mint tokens that give read and write access to repositories. That means exposure of private images and any secrets inside them, and the ability to replace images that other systems pull. Affected: Red Hat Quay 3 and 5, including standalone deployments, the Quay Operator on OpenShift and the mirror registry for OpenShift, according to The Hacker News' reading of Red Hat's data. Exploited in the wild: none of the coverage I read says so, and one vendor write-up lists "no public exploit". That can change quickly. Fix: upstream fixes were merged on 11 November. Red Hat has published fixed builds for several Quay 3 branches. See the version note below. How the attack works Quay signs the tokens that authorize registry access. The signing keys are managed by a service key server, and keys can be rotated through an API. According to The Hacker News, the key server accepts a rotation request if it carries a token signed by a trusted key with the expected audience and issuer. It does not check that the token was issued for key rotation. That is the gap: An unauthenticated client requests an anonymous registry token from the auth endpoint (/v2/auth) and chooses the audience. That token passes the key server's checks, so the client can ask the key server to add or rotate a key. The attacker's key is accepted as trusted. It can be set with no expiry, and it survives restarts. With that key the attacker can sign tokens that Quay honors for any repository, and can pull private images or push tampered ones under existing tags. Red Hat's report also says the rotation deletes the legitimate instance key as a side effect, and the attacker's key can delete replacement keys. That can break legitimate pushes and pulls. Two points from Red Hat that change what you might assume: Turning off anonymous access does not protect you. Red Hat says any valid Quay account can still exploit the flaw. Resetting passwords or regenerating robot tokens does not remove the attacker's key. The key lives in Quay's key store, not in a user credential. A second flaw in the same fix: CVE-2026-110697 The same researcher, Red Hat's Dave O'Connor, found a related issue, scored 9.9. As The Hacker News describes it, the robot-account listing code builds a SQL LIKE pattern from the namespace name without escaping wildcards. In SQL LIKE, an underscore matches any single character, so a crafted namespace can match another tenant's namespace and return its robot accounts with their tokens. The only prerequisite reported is the ability to create a namespace. Stolen robot tokens allow reading, pushing or overwriting another tenant's images. This one is easier to understand if you have written SQ...

Powered by Readybot.io
Red Hat Quay CVE-2026-123710: Critical Registry Risk

Indonesia Port API Adds Verified Coordinates

DEV Community

Indonesia's Official Port List Has No Coordinates, So I Added Them Without Guessing

Indonesia's official port list is the National Port Master Plan (Rencana Induk Pelabuhan Nasional, RIPN): ministerial decree KP 432 Tahun 2017 and its amendments. It comes as a scanned PDF annex, and it has no coordinates at all. I turned that annex into data and matched every port against open coordinate sources. The result is the Port API on API Indonesia, under /api/v1/pelabuhan. What is in it 1,082 ports: 637 sea ports and 445 ferry ports. The official hierarchy of every sea port for the 2022–2027 period: 28 main ports (utama), 164 collector ports (pengumpul), 165 regional feeder ports and 279 local feeder ports. The planned 2027 and 2037 hierarchy is kept too. The class of every ferry port (I, II, III). Province and regency/city with Kemendagri codes. UN/LOCODE for 133 ports and World Port Index attributes (harbour size, channel depth) for 84. Latitude and longitude for the 468 ports that pass validation. How the coordinates were checked Coordinates come from OpenStreetMap, the NGA World Port Index and UN/LOCODE. A coordinate is only filled when it passes one of two levels: terverifikasi (178 ports): at least two independent sources agree within 5 km, and the point is in the same province as the RIPN entry. sebagian (290 ports): one source so far, an exact name match, and the point falls in the same province and regency as the RIPN entry. Anything else keeps lat and lng empty with validasi = tanpa_koordinat. There are no estimated positions and no regency centroids. 18 points landed in a different regency from the one the RIPN lists, and those coordinates were dropped. Using it Nearest ferry ports to a point: curl "https://use.apiindonesia.id/api/v1/pelabuhan/nearby?lat=-5.93&lng=106&jenis=penyeberangan" \
- H "x-api-key: YOUR_API_KEY"
All main ports: curl "https://use.apiindonesia.id/api/v1/pelabuhan?hierarki=utama&per_page=30" \
- H "x-api-key: YOUR_API_KEY"
You can also look a port up by UN/LOCODE, for example /api/v1/pelabuhan/IDJKT for Tanjung Priok. Limits More than half of the ports have no coordinate yet, mostly local feeder ports and small ferry ports. They are still in the dataset because their name, administrative location and hierarchy are official, but the point is only added once a source can be checked. A few more things to know: The amendments in KM 172 Tahun 2021 and most of KM 217 Tahun 2022 are not applied yet, because the decree files could not be retrieved. The RIPN annex is a scan, so some names were cleaned of OCR errors. A sea port and a ferry port with the same name often share one point. Most coordinates come from OpenStreetMap (ODbL 1.0). Every response carries meta.attribution. Pricing: 2 credits (Rp2) per successful request, and failed requests are free. Product page: https://apiindonesia.id/produk/pelabuhan/ Docs: https://docs.apiindonesia.id/#pelabuhan

Powered by Readybot.io

Indonesia Port API Adds Verified Coordinates

Fix GitHub Actions Reusable Workflow Not Found

DEV Community

GitHub Actions reusable workflow was not found

GitHub Actions reusable workflow was not found means the uses: reference was well formed but resolved to nothing: the file is not directly under .github/workflows at that ref, the ref does not exist on the target repository, or the caller is not allowed to read it. The annotation prints every hop as a chain of arrows, so check the entry after the last arrow first; on a nested call it is often a reference inside a workflow you did not write. Four checks in order: the path exists, the ref exists, the caller may read it, and the file declares that it can be called. The chain stops at the first failure. What this error means The run is created and then ends immediately, with no jobs and no logs. In the Actions tab it carries an annotation titled with the caller file and a line number, and the body is a chain of quoted references joined by arrows, ending in a colon and the words that give this page its name. Because nothing ran, there is no step to open and any tooling looking for a failed job finds none. The chain is the diagnosis: each arrow is one hop the resolver made, so the reference on the last line is the one that could not be loaded. On a nested call that line is often a workflow you did not write the reference for. ```Invalid workflow file annotation, quoted from wazuh/wazuh-dashboard-plugins#9158 error parsing called workflow ".github/workflows/4_builderpackage_dashboard.yml" -> "wazuh/wazuh-security-dashboards-plugin/.github/workflows/[email protected]" (source tag with sha:e9267cedfeaf707032ac9454ce494a32745585a3) --> "./.github/workflows/4_builderprecompiled_base-dev-environment.yml" : workflow was not found. See https://docs.github.com/actions/learn-github-actions/reusing-workflows#access-to-reusable-workflows

Common causes

The path or the file name is wrong

The ordinary case. A called workflow must sit directly in the workflows directory, so a file moved into a subdirectory stops resolving, and so does an extension that is .yaml on one side and .yml on the other. The message names the file it looked for.

The ref does not exist on the target repository

Refs are resolved on the repository that owns the called workflow, not on yours. A release that tags several repositories at once is the usual source: the tag exists where you are standing but not where you are calling.

The called workflow does not declare workflow_call

The file is found and still refused, because nothing marks it as callable. This one has its own wording, about a missing trigger rather than a missing workflow, and it is common when a manually run workflow gets reused.

The caller cannot read the target repository

A private or internal repository has to allow its workflows to be used elsewhere, and the setting lives on the target rather than on the caller. Nothing about the reference looks wrong, which is why the error links the access documentation.

The failing reference is one level down

Resolution recurses, so a workflow you call may call others, and a relative reference inside it resolves against its own repository and commit. The chain is the only place that distinction is visible.

How to fix it

Read the chain from the bottom up

  1. Find the entry after the last arrow: that is the reference that failed.
  2. Note which repository it belongs to, which is the repository of the entry above it for a relative reference.
  3. Check the path, then the ref, then the access, in that order, against that repository.

Confirm the file and the ref from the API

One call tells you whether the file exists at that ref on that repository, answering the path and ref questions together.

```Terminal (illustrative)
$ gh api repos/octo-org/shared/contents/.github/workflows/package.yml?ref=v2 --jq .name
$ gh api repos/octo-org/shared/git/ref/tags/v2 --jq .object
Make the called workflow callable A workflow becomes reusable by declaring the trigger, and it can carry several at once. Ke...

Powered by Readybot.io

Fix GitHub Actions Reusable Workflow Not Found