Hi, everyone :)! I'm Juan Yaguaro (aka silverhacker), the creator of Ada. I've been developing this project for a few months now. It's an important project to me because it's a lightweight desktop virtual assistant developed in C++, without heavy frameworks like Electron or Node.js :), just pure C++. Ada's goal is to be "what Cortana or other assistants never were" :). I've been building it with SDL2, cURL for the online AI, and llama.cpp for the offline mode (CPU-only for now because I don't have a dedicated GPU, XD). If you want to know more about my project, check out my GitHub repository here: https://github.com/Silver148/Ada-Virtual-Assistant I'd love any feedback :D!
Powered by Readybot.io
DEV Community
Australia Daily AI & LLM Briefing - November 16, 2026
Australia Daily AI & LLM Briefing - November 16, 2026 A curated intelligence briefing on AI infrastructure, enterprise agent governance, sovereign compute, regulatory overhauls, and foundation model deployments across the Australian technology ecosystem over the past 24 to 48 hours. 1. Top Headlines & Major Announcements Microsoft Outages Put Canberra's Resilience Pact to the Test as Phishers Exploit M365 & Copilot Disruption Following Friday's cascading outage across Microsoft 365, Teams, and Copilot that disrupted federal agencies and private enterprises across Australia, Canberra's multi-cloud "Resilience Pact" has come under intense scrutiny. Security researchers at iTnews Australia warned that cybercriminals immediately deployed opportunistic phishing campaigns impersonating IT service desks restoring M365 access, attempting to harvest session tokens and bypass multi-factor authentication while enterprise systems recovered. Policy analysts in Canberra note that the event will accelerate federal procurement requirements for sovereign compute redundancy and multi-cloud fallback architectures. Sources: InnovationAus | iTnews Australia AMD Unveils 256-Core Zen 6 EPYC Venice Server Chip, Challenging NVIDIA's Data Centre Dominance AMD has taken the wraps off its sixth-generation Zen 6 EPYC "Venice" server processor, packing 256 dense cores into a single socket. Highlighted by Australian enterprise infrastructure analysts as a pivotal shift in AI and high-performance compute hardware, Venice challenges NVIDIA's hardware leadership and offers Australian data centre operators new architectural options for dense inference, sovereign compute clusters, and energy-efficient AI workloads amid mounting power grid constraints in Sydney and Melbourne. Sources: iTWire Australia Warns of Escalating AI-Driven Scams & Account Takeovers as Annual Losses Hit AU$2.18B Australian federal authorities and consumer security bodies have issued an urgent advisory warning that generative AI, neural voice cloning, and automated credential stuffing are making impersonation scams and account takeovers far harder to detect. With Australians reporting AU$2.18 billion in scam losses in 2025, legal scholars and safety advocates are pointing to Victoria's pioneering mandatory seat-belt laws as a blueprint for Canberra, urging "built-in by design" AI safety standards before autonomous agents entrench themselves across critical banking and telecommunications infrastructure. Sources: TechDay Australia (AI Scams) | TechDay Australia (Public Safety Legacy) Amazon Moves to Fortify Proprietary Product Data Against Autonomous AI Shopping Agents Amazon has outlined an extensive strategic defence designed to shield its structured global product catalogues from being crawled, indexed, and intermediated by third-party autonomous AI shopping agents. As autonomous purchasing agents and agentic commerce workflows begin testing in the Australian retail market, the initiative signals an escalating battle between proprietary commercial data owners and external AI models attempting to intermediate consumer transactions. Sources: iTnews Australia 2. Model & Open-Source Technical Advancements Google Cloud Enables BigQuery Direct Queries on Databricks Iceberg to Break Down AI Lakehouse Silos Google Cloud introduced bi-directional Apache Iceberg interoperability, allowing BigQuery query engines to analyse Databricks-managed Iceberg lakehouses directly without moving or duplicating underlying data. Australian data platform architects and enterprise AI engineering teams can now run high-performance analytics and retrieval-augmented generation (RAG) pipelines seamlessly across lakehouses while eliminating cross-cloud egress costs. Sources: ITBrief Australia ArmourCode Releases Open-Source Guardrail Hooks to Block Autonomous Coding Agent Risks Enterprise application security leader ArmourCode has released an open-source pre-execution hooks framework engineered specifically to restri...
Powered by Readybot.io
DEV Community
Điểm tin AI & Mô hình Ngôn ngữ Lớn (LLMs) tại Úc - Ngày 16/11/2026
Điểm tin AI & Mô hình Ngôn ngữ Lớn (LLMs) tại Úc - Ngày 16/11/2026 Bản tin tổng hợp chuyên sâu về hạ tầng AI, quản trị agent doanh nghiệp, điện toán có chủ quyền, cải cách pháp lý và triển khai mô hình nền tảng trên khắp hệ sinh thái công nghệ Úc trong 24 đến 48 giờ qua. 1. Tiêu điểm & Các Công bố Quan trọng Sự cố Microsoft Đặt Hiệp ước Chống chịu của Canberra vào Thử thách Khi Tin tặc Lợi dụng Gián đoạn M365 & Copilot Sau sự cố sập diện rộng các dịch vụ Microsoft 365, Teams và Copilot làm gián đoạn nghiêm trọng các cơ quan chính phủ và doanh nghiệp tại Úc vào cuối tuần qua, "Hiệp ước Chống chịu" đa đám mây của Canberra đang được xem xét khẩn cấp. Các chuyên gia an ninh tại iTnews Australia cảnh báo tội phạm mạng đã lập tức tung ra các chiến dịch lừa đảo mạo danh bộ phận hỗ trợ kỹ thuật khôi phục M365 nhằm đánh cắp mã truy cập và vượt qua xác thực đa yếu tố. Các nhà hoạch định chính sách tại Canberra nhận định sự cố này sẽ đẩy nhanh các yêu cầu bắt buộc về dự phòng điện toán chủ quyền và kiến trúc đa đám mây trong mua sắm công. Nguồn trích dẫn: InnovationAus | iTnews Australia AMD Ra mắt Chip Máy chủ Zen 6 EPYC Venice 256 Nhân, Thách thức Vị thế Thống trị của NVIDIA tại Trung tâm Dữ liệu AMD vừa chính thức công bố bộ xử lý máy chủ thế hệ thứ sáu Zen 6 EPYC "Venice" với mật độ lên tới 256 nhân trên một socket duy nhất. Được các chuyên gia hạ tầng doanh nghiệp tại Úc đánh giá là bước ngoặt lớn đối với phần cứng AI và điện toán hiệu năng cao, dòng chip Venice thách thức trực diện vị thế dẫn đầu của NVIDIA và mang đến cho các nhà vận hành trung tâm dữ liệu Úc lựa chọn mới cho suy luận mật độ cao, cụm điện toán chủ quyền và khối lượng công việc AI tối ưu năng lượng trước áp lực lưới điện tại Sydney và Melbourne. Nguồn trích dẫn: iTWire Cảnh báo Lừa đảo Ứng dụng AI và Chiếm quyền Tài khoản tại Úc Khi Thiệt hại Đạt 2,18 Tỷ AUD Các cơ quan quản lý và an toàn tiêu dùng liên bang Úc vừa ban hành cảnh báo khẩn cấp trước sự gia tăng của các vụ lừa đảo mạo danh và chiếm đoạt tài khoản ứng dụng AI tạo sinh, giả mạo giọng nói nơ-ron và tấn công tự động. Trong bối cảnh người dân Úc ghi nhận mức thiệt hại 2,18 tỷ AUD trong năm 2025, giới học giả pháp lý và chuyên gia an toàn đã nhắc lại tiền lệ tiên phong của bang Victoria về luật thắt dây an toàn bắt buộc, kêu gọi Canberra ban hành tiêu chuẩn an toàn AI "tích hợp từ thiết kế" (built-in by design) trước khi các tác nhân tự hành thâm nhập sâu vào hạ tầng ngân hàng và viễn thông. Nguồn trích dẫn: TechDay Australia (AI Scams) | TechDay Australia (Public Safety Legacy) Amazon Hành động Bảo vệ Dữ liệu Sản phẩm Độc quyền Trước Các AI Shopping Agent Amazon đã vạch ra sáng kiến chiến lược nhằm củng cố danh mục dữ liệu sản phẩm toàn cầu trước hoạt động thu thập, lập chỉ mục và trung gian hóa của các tác nhân AI mua sắm tự hành bên thứ ba. Khi các mô hình mua sắm tự hành và quy trình thương mại agentic bắt đầu thâm nhập thị trường bán lẻ tại Úc, động thái này báo hiệu cuộc cạnh tranh ngày càng gay gắt giữa các đơn vị nắm giữ dữ liệu thương mại độc quyền và các mô hình AI ngoại vi. Nguồn trích dẫn: iTnews Australia 2. Tiến bộ Mô hình & Công nghệ Nguồn Mở Google Cloud Cho phép BigQuery Truy vấn Trực tiếp Databricks Iceberg Xóa bỏ Rào cản Dữ liệu AI Google Cloud vừa bổ sung khả năng tương tác hai chiều với Apache Iceberg, cho phép công cụ BigQuery truy vấn trực tiếp kho dữ liệu Databricks Iceberg mà không cần sao chép hay di chuyển dữ liệu gốc. Đội ngũ kiến trúc sư nền tảng dữ liệu và kỹ sư AI doanh nghiệp tại Úc nay có thể vận hành các đường ống phân tích hiệu năng cao và hệ thống RAG liền mạch, loại bỏ triệt để chi phí tải dữ liệu qua lại giữa các đám mây. Nguồn trích dẫn: ITBrief Australia ArmourCode Ra mắt Bộ Hook Nguồn mở Chặn Rủi ro từ Tác nhân Lập trình Tự hành (Claude Code) Nhà cung cấp bảo mật ứng dụng doanh nghiệp ArmourCode vừa phát hành khung hook tiền thực thi (pre-execution hooks) mã nguồn mở nhằm kiểm soát phạm vi rủi ro của các tác nhân lập trình dòng lệnh tự hành như Claude Code của An...
Powered by Readybot.io
DEV Community
Exploring Global Air Pollution Trends with Python and Pandas
python #datascience #dataanalytics #environment Air pollution is a major environmental health concern. I wanted to understand how air quality differs between countries and how pollution levels changed over time. This led me to build my Global Air Quality Analysis project. Project Overview The project explores annual PM2.5 exposure data for 87 countries between 2010 and 2019. PM2.5 refers to fine particulate matter with a diameter of 2.5 micrometres or less. The analysis uses data attributed to the World Health Organization's Global Health Observatory, accessed through Our World in Data. My Analytical Process The project follows a workflow covering data cleaning, validation, country comparisons, trend analysis and visualisation. Using Python, Pandas, NumPy and Matplotlib, I explored questions such as: Which countries had the highest reported exposure? How did average exposure change between 2010 and 2019? Which countries showed improvements? How did regional trends differ? Selected Results The repository reports the following dataset findings: Indicator Result 2010 average PM2.5 35.3 µg/m³ 2019 average PM2.5 31.7 µg/m³ Highest 2019 value Kuwait, 64.1 µg/m³ Lowest 2019 value Bahamas, 5.2 µg/m³ Largest reported improvement China, −9.0 µg/m³ These figures describe the analysed dataset and its averaging method. They should not automatically be interpreted as population-weighted global exposure estimates. Understanding the Limitations One important detail is that the project uses the historical WHO guideline of 10 µg/m³ for annual PM2.5 exposure. The WHO updated its annual guideline to 5 µg/m³ in 2021. The dataset also contains modelled national estimates rather than continuous direct measurements from every location. National averages can hide substantial differences between cities, rural areas and seasons. What I Learned This project helped me practise translating environmental datasets into understandable visualisations. It also highlighted why analytical conclusions need to explain their data sources, time periods and limitations. Future Work I would like to explore newer observations, uncertainty intervals and comparisons between urban and rural exposure. GitHub: https://github.com/tasnem-tech/global-air-quality-analysis How do you communicate uncertainty when presenting environmental data?
Powered by Readybot.io
DEV Community
Flisk: run a multi-service app on your laptop with one command (and what it does not do)
Flisk is an open-source command-line tool that runs every part of a multi-service app (API, website, worker, database) on your own computer with one command. The README says a small app starts "as two local processes in about a second", with no Docker. Repo URL: https://github.com/flisk-sh/flisk Language: TypeScript CLI (Ink terminal UI). Runs on Node.js 22.12+. Your own services can be Node, Python, Go, Rust, JVM, Ruby or PHP. Try it: npx @flisk-sh/flisk demo. No signup, no global install. With Docker and Tilt it starts a six-service restaurant demo with Postgres, one gateway and live reload. Without them it starts a small menu app as two local processes at http://localhost:3000, and flisk down stops it. CLI: flisk create asks a few questions and writes a project that runs. flisk import . reads a docker-compose.yml and writes one service.json per Compose service, keeping ports, names and env values. flisk up starts services in health-checked dependsOn order and prints a .localhost URL for each. flisk status, flisk logs and flisk doctor show what is running and what is wrong. flisk down stops everything. Config: One small service.json per service. From it Flisk writes the Dockerfile, the Compose entry, the Traefik route, the health check and DATABASE_URL. It refuses to start if a generated file was edited by hand, and flisk config verify reports drift. Docker: Optional. Services that each declare a command run as plain local processes. A database, one gateway URL for every service, or the same container you deploy need Docker (Engine 25+) and Tilt 0.25+. For AI helpers: flisk mcp is an MCP server with 24 tools for Claude Code, Codex and Cursor. flisk connect claude (or cursor, codex) adds it. The idea is that the helper writes your app and Flisk writes the setup around it, the same way every time. Speed (from the repo's own benchmarks): A plain Compose app (a Node API and Postgres) answered through Flisk's router 49 s after flisk import on a clean Ubuntu CI runner, images pulled and built from scratch. With warm image layers, a one-backend stack is healthy in 12.8 to 13.8 seconds. An 8-service stack settles in 32 to 42 seconds warm and about 4.5 minutes on its first cold build. Licence: MIT. flisk up needs no key. Premium extras are optional. Maturity: The npm package is at 1.4.x and the repo has thousands of commits. The README lists five teams that run flisk up on their own code, with their consent. The timings above come from CI runs the README links, not from an independent benchmark. Not a deploy tool: It does not emit Kubernetes manifests and does not replace Helm, Kustomize, Flux or Argo. The one export scope is opt-in: flisk export render, wrangler and compose write render.yaml, wrangler.toml or a standalone docker-compose.yml. They write files only. They never deploy and never call a cloud API. Windows: flisk demo and local processes work natively. The full Docker stack runs in Ubuntu on WSL2. Not mentioned: Memory use compared with plain Compose, support for apps that need a local Kubernetes cluster, and any third-party benchmark. When it fits, and when it does not It fits when you run 3 to 10 services locally, you are tired of keeping a Compose file, a Tiltfile and a gateway config in sync by hand, or you want an AI helper to start and fix your stack without rewriting a Dockerfile each time. It does not fit when your app is a single process, when your local setup already needs a real cluster, or when you want a tool that also ships to production. Try it in 30 seconds npx @flisk-sh/flisk demo
Already have a Compose file? npx @flisk-sh/flisk import .
npx @flisk-sh/flisk up
Add --dry-run to import to preview first. Repo: https://github.com/flisk-sh/flisk · Site: https://flisk.sh
Powered by Readybot.io*
DEV Community
Props in React
When building a React application, we usually divide our application into small components. For example, an e-commerce website may have: Navbar component Product component Cart component Footer component Sometimes, one component needs to send data to another component. This is where Props come in. 1. What are Props? Props stands for Properties. Props allow us to pass data from one component to another in React. In simple words, props help components share data with other components. For example, we can send a username from the App component to the Profile component. 2. How to Pass Props? Let's understand with a simple example. App.jsx function App() {
return (
);
}
export default App;
Here, we are passing name="Lokesh" to the Profile component. Profile.jsx function Profile(props) {
return (
Hello, {props.name}
);
}
export default Profile;
Output: Hello, Lokesh
Let's understand what happened: App sends the name Lokesh to Profile. Profile receives the data through props. We display the name using props.name. That's how props work! 3. Passing Multiple Props We can pass more than one value to a component. function App() {
return (
);
}
Now, we can receive these values in the Student component. function Student(props) {
return (
Name: {props.name}
Age: {props.age}
Course: {props.course}
);
}
We can pass different types of data through props, such as: Strings Numbers Arrays Objects Functions Boolean values 4. What is Props Destructuring? Instead of writing props.name, props.age, and props.course every time, we can use destructuring. Example: function Student({ name, age, course }) {
return (
Name: {name}
Age: {age}
Course: {course}
);
}
Here, we directly get the values from props. This makes our code shorter and easier to read. 5. Passing Props to Reusable Components One of the biggest advantages of props is that we can reuse the same component with different data. Imagine we are creating an e-commerce website with multiple product cards. Instead of creating a separate component for every product, we can create one reusable Product component. App.jsx function App() {
return (
);
}
The same Product component displays different products based on the props it receives. This helps us avoid writing the same code again and again. 6. Important Rules About Props There are a few important things to remember: Props are used to pass data between components. Data usually flows from parent components to child components. Props can contain different types of values. Props are read-only. A child component should not directly modify the props it receives. We can use destructuring to make props easier to read. 7. Props vs State Props and State are both used to work with data in React, but they have different purposes. Props State Used to receive data from a parent component Used to manage data inside a component Read-only for the receiving component Can be updated using a state setter Passed from parent to child Managed by the component that owns it For example: Props: Passing a product name from App to Product. State: Updating the quantity of a product when the user clicks the + button.
Powered by Readybot.io
DEV Community
AI is the assistant, not the staff
The series so far: The specification comes first. Why I write a specification before any screens, and the tests I hold one to. The specification had to change. The review of version 3 asked for decisions, not features, and those decisions became version 4. Build in stages. The build order version 4 created, the five stages in the running site, and why payments waited. What you can do on the site today. A tour of Exit 719 as it stood: one account, many groups, what members and owners see, and what was not built yet. This post. Who is in the room while I build: the AI tools I use, the weekly limit on each, and the decisions I keep. The first four posts were about the specification, the review that changed it, the stage order, and what Exit 719 does today. This one is about who is in the room while I build it. Most days that is me, and an AI assistant with a weekly limit. What I used to have At my last company I still did the coding, the AWS work, and the version control. The staff was lean. We had a few coders, a design team, and a CSS team. The coders split their time between SQL Server and C# on .NET 4. The pages were AJAX. We used libraries that already contained the grids, the editors, and the other controls, so a screen started from a part that existed. That was a small team, and it was still a team. Someone else could look at a page. Someone else owned the stylesheet. Someone else had already built the control I was about to drop on a form. This time I am solo. Exit 719 is .NET 10, Razor pages, and PostgreSQL, on a Linux machine I set up myself. There is no control library waiting for me, and there is no second developer at the next desk. AI is the assistant I use to review documents and code, and to show me the strong points and the weak ones. It is not a second employee. It does not own the specification, and it does not decide when a stage is done. The tools, and the limit on each one On this computer I use two Grok applications, SuperGrok and Grok Bot. Each one has its own weekly usage limit. When a tool is near the limit, I stop and decide what is worth the rest of the week. That limit is useful. It keeps me from asking for ten half-thought changes at midnight. I also use Poe when I want another model, or when I want a chunk of code or a document review that should not come from the same model that wrote the draft. Poe can reach the other major models. I send the same review to more than one of them. They do not agree. That is why I do it. A single review agrees with the person who wrote the page. Two reviews argue, and the argument is where the weak spot shows up. I am also putting Claude Code on this machine, a local application, to help with the code itself. Grok has been the environment and the long specification work. Poe has been the second opinion. Claude Code is the next pair of hands in the editor. None of them replace the decision. The prompt is a document, not a sentence The habit that matters most is the same habit as the specification. When I want a change, I write a prompt document. I read it more than once. I fix the vague lines before I hand it to the bot. Then the local bot implements that document. The writing is what flushes the idea out. By the time the bot sees it, the feature has a shape: what the screen shows, what it must not do, and what "done" means. Version 3 of the Exit 719 specification went through that kind of review before it became version 4. A prompt for a smaller change goes through a shorter version of the same pass. If I skip it, I get a confident answer to a question I had not finished asking. The machines I run Zorin Linux. Grok integrated Visual Studio Code on that machine. It could have been another Linux. The point is that the bot sat with me through the setup: the local environment, GitHub, and AWS. I have built AWS environments myself for years. This time I gave the bot the prompts, it did the setup, and it saved me a few days. It also set up the GitHub repository, prepa...
Powered by Readybot.io
DEV Community
Building a Privacy-First Password Strength Checker with JavaScript
javascript #cybersecurity #webdev #showdev Password security is an important part of everyday digital safety. For my SecurePass project, I wanted to explore how a browser-based application could provide useful password feedback without sending the entered password to a server. Introducing SecurePass SecurePass is an educational password strength analyser and random password generator built using HTML, CSS and JavaScript. The application runs locally in the browser. Its main features include: Live password strength feedback Common-password and predictable-pattern checks Improvement suggestions Random password generation Responsive design Automated tests How Password Analysis Works The application evaluates factors such as password length, character variety and predictable patterns. It then displays a score between 0 and 100. However, this is a heuristic score. A high score does not guarantee that a password is secure. A password may look complex but still be compromised, reused or vulnerable to other attacks. Generating Random Passwords One technical decision was using the browser's Web Crypto API. The generator uses crypto.getRandomValues() as its source of secure randomness. It also uses rejection sampling to avoid modulo bias when selecting characters. This is preferable to relying on Math.random() for security-sensitive password generation. Privacy Considerations SecurePass does not require a backend to analyse passwords. The repository documents that passwords are not uploaded, stored or sent to analytics services. There are still limitations. For example, copying a password to the system clipboard can expose it to other software. The application also does not check whether a password has appeared in a known data breach. Testing and Future Improvements The project includes automated tests using Node.js's built-in test runner. Planned improvements include: Evaluating a well-reviewed password estimation library Adding continuous integration Improving accessibility testing Adding a real application screenshot What I Learned This project helped me explore privacy-aware frontend design, browser cryptography and automated testing. It also reinforced the importance of communicating security limitations clearly. For real accounts, I recommend using unique passwords, a trusted password manager and multi-factor authentication. GitHub: https://github.com/tasnem-tech/securepass-password-checker What additional security features would you consider useful in an educational password tool?
Powered by Readybot.io
DEV Community
Browser Image Upload to Object Storage: 4 Retention Checks for Logistics Exports
Browser Image Upload to Object Storage: 4 Retention Checks for Logistics Exports Short answer: use a private bucket, let the server create a tenant-bound object key, and give the browser a presigned upload URL. For logistics product images, the difficult decision is not how to move bytes. It is what deletion means after an export has been generated. Option Browser upload Retention boundary Tenant export fit Choose it when Amazon S3 Presigned PUT or POST Lifecycle, versioning, Object Lock options Strong AWS governance is already in place Google Cloud Storage Signed URLs Lifecycle and retention policies Strong The application is GCP-native Cloudflare R2 Presigned URLs Lifecycle semantics need careful review Good The wider system is Cloudflare-centered A shared REST storage surface Presigned URLs Private objects plus application-managed deletion Good for smaller teams Minimal SDK and credential glue matters My decision rule is narrow: choose the shared REST path when private tenant images, explicit application deletion, and a short implementation path matter more than storage-native retention locks or replication. Infrai's concrete advantage is one REST API: pure HTTP, no SDK to install, and any runtime that can send an HTTP request can call it. One key covers a broad backend surface with one bill, which reduces credential inventory and glue when the workflow later connects image processing to storage. It does not turn a prefix into an authorization policy or make deletion immutable. The limitation is just as important: one key and one bill also create a wider trust boundary. Infrai's second advantage is a single key and a single bill across the broader backend surface, which removes credential inventory and billing reconciliation work when image processing connects to storage. If your security review requires separate provider accounts or independent billing controls, choose direct S3 or GCS instead. The second advantage is a single key and a single bill across the broader backend surface. That removes a credential inventory and billing reconciliation step when image processing connects to storage. How can I upload an image directly to object storage using browser JavaScript? Very little. The application server should know the tenant, user, generated object key, and retention class. The browser needs a file input, a temporary upload URL, and the result of the upload. It should never receive the platform credential. Keep it private. For a product catalog, I would use a key such as tenant_42/products/sku-8841/source.jpg. That prefix makes listing and cleanup understandable. It is not a security boundary. The database still decides whether the current user may write or read that object. The server creates one presigned URL for one intended object. It records the object location only after checking the upload response, then associates that location with the tenant and product row. A filename supplied by a user is data, not an object identity. Generate the key on the server. Here is the small TypeScript boundary. The presign function belongs on the application server. The file upload itself goes to the returned URL, without the platform authorization header. const apiKey = process.env.INFRAI_API_KEY;
const apiBase = process.env.INFRAI_API_BASE_URL;
if (!apiKey || !apiBase) throw new Error("INFRAI_API_KEY and INFRAI_API_BASE_URL are required");
GitHub just made workflow lockfiles generally available, and the gh actions-lock command finally answers a question that SHA pinning never could: what about the actions your actions call? A GitHub Actions workflow lockfile records exact commits for actions and their transitive dependencies, while your YAML keeps its readable @v4 style references. That's the release. The harder part is rolling it out without freezing CI, and knowing what it still doesn't prove. TL;DR A lockfile fixes which commit runs, including the nested actions you never see in your YAML. It's a real upgrade over hand pinning the top level only. Roll it out one workflow at a time, and add a guard that fails a PR when a uses: line changes without the lockfile changing. It says nothing about how an action was built or whether your repo is configured safely. SLSA provenance and OpenSSF Scorecard cover those, and you still need both questions answered. Dependency risk in workflow YAML Here's the workflow most of us have in a repo right now: # .github/workflows/ci.yml
name: ci
on: [pull_request]
permissions:
contents: read
jobs:
test:
runs-on: ubuntu-latest
steps:
- uses: actions/checkout@v4
- uses: your-org/setup-toolchain@v2
- run: npm test
Two uses: lines, and they look harmless. But @v2 is a Git tag, and a tag is a pointer that someone with write access can move. If setup-toolchain is a composite action, it has its own uses: lines inside its action.yml, and those have their own tags. You reviewed two lines. You're running a tree. The old fix was replacing every tag with a 40 character SHA. It works for the top level, it makes the YAML unreadable, and it doesn't reach the nested layer unless the action's author pinned too. You can't pin someone else's action.yml from your repo. That gap is the footgun, and it's the specific thing the lockfile closes. This matters more once your pipelines do real work on their own. If you're moving toward production AI agent workflows, CI is where those agents get tokens, and an action you never reviewed runs with the same job permissions as the ones you did. gh actions-lock migration Before you generate anything, find out what you have. This script needs only the Python standard library. It reads your workflows and any local composite actions, then sorts each reference by how it's pinned: #!/usr/bin/env python3
def classify(ref: str) -> str:
if ref.startswith("./"):
return "local"
if ref.startswith("docker://"):
return "docker"
if "@" not in ref:
return "unknown"
return "sha" if SHA.match(ref.rsplit("@", 1)[1]) else "mutable"
root = pathlib.Path(".github")
files = [p for p in root.rglob("*") if p.suffix in {".yml", ".yaml"}]
found = collections.defaultdict(set)
for path in files:
for line in path.read_text(encoding="utf-8").splitlines():
match = USES.match(line)
if match:
found[classify(match[1])].add(f"{match[1]} ({path})")
for kind in sorted(found):
print(f"\n{kind}: {len(found[kind])}")
for item in sorted(found[kind]):
print(f" {item}")
The mutable bucket is your migration list. Now resist doing the whole org in one PR. Here's the order I'd use: Audit with the script above and save the output, so you've got a before picture. Lock one workflow that's low stakes but runs often. A docs build is ideal. Run gh actions-lock, commit what it generates, and read the result before you merge. I'm leaving flags out on purpose: the changelog entry and gh actions-lock --help are the source of truth for a tool this new. Review the transitive entries. This first read is where you'll learn what your actions actually depend on. Expand to the workflows that hold deploy credentials once a few normal PRs have passed through. Transiti...
Powered by Readybot.io
DEV Community
Building TeachBack AI: An Adaptive Study Coach Using NLP
Tags: #ai #python #machinelearning #education Have you ever read a chapter several times, felt confident about it, and then struggled to explain the topic without looking at your notes? This is one of the learning problems I wanted to explore when developing TeachBack AI. What Is TeachBack AI? TeachBack AI is an adaptive study-coaching application that encourages students to explain concepts in their own words. Rather than simply asking learners to recognise the correct answer, the application uses a teach-back approach. The basic learning cycle is: Read or upload study notes. Identify important concepts. Explain a concept in your own words. Receive feedback. Practise weaker areas. Track progress over time. The Technology The project uses natural language processing and semantic similarity. Its documented components include: Sentence-BERT: The all-MiniLM-L6-v2 model is used to compare the meaning of student explanations with source material. TF-IDF: Helps identify important terms and concepts. Cosine similarity: Supports text comparison and provides a fallback mechanism. Streamlit: Provides the interactive user interface. The application is designed to run without a paid API key. Why Semantic Similarity? Two explanations can express similar ideas using different words. A simple keyword-matching system may struggle to recognise this. Semantic embeddings provide a way to compare text based on learned representations of meaning. However, similarity does not guarantee factual correctness or deep understanding. A response can be semantically close to reference material while still containing errors. Adaptive Learning TeachBack AI uses mastery information to prioritise topics where the learner appears to need more practice. The repository also describes features such as missing-concept detection, adaptive cloze practice and progress tracking. The objective is to encourage active explanation rather than passive rereading. Limitations This is an educational prototype. It has not been established that the system improves learning outcomes compared with conventional teaching methods. The quality of its feedback depends on the source notes, concept extraction and similarity model. Future evaluation should involve real learners, human-reviewed explanations and comparisons with established study methods. What I Learned Building this project helped me explore how NLP can support an interactive educational workflow. It also highlighted the difference between measuring text similarity and measuring actual student understanding. Conclusion TeachBack AI is part of my interest in applying machine learning to practical educational problems. GitHub: https://github.com/tasnem-tech/teachback-ai Do you think AI study tools should focus more on generating answers or helping students explain concepts themselves?
Powered by Readybot.io
DEV Community
Props Drilling in React
When building React applications, we use props to pass data from one component to another. But what happens when we need to pass data through multiple components, even when some of those components don't need that data? This is called Props Drilling. Let's understand it with a simple example. 1. What is Props Drilling? Props Drilling happens when we pass data from a parent component to a deeply nested child component through multiple intermediate components. In simple words, we pass props through components just to reach another component that actually needs the data. 2. Understanding Props Drilling with an Example Imagine we have three components: App Profile User The App component has a username, and the User component needs to display it. But the User component is inside the Profile component. Let's see how we pass the data. App.jsx function App() {
const username = "Lokesh";
return ;
}
export default App;
Here, App sends the username to Profile. Profile.jsx function Profile({ username }) {
return ;
}
Profile receives the username and passes it to User. User.jsx function User({ username }) {
return
Welcome, {username}
;
}
export default User;
User finally receives the username and displays it. Output: Welcome, Lokesh
3. Why is This Called Props Drilling? Look at how the data travels: App
|
| username
↓
Profile
|
| username
↓
User
The App component sends the username to Profile. Profile doesn't need the username for its own purpose. It only passes it to User. This repeated passing of props through intermediate components is called Props Drilling. 4. What Problems Does Props Drilling Cause? Props Drilling is not always bad. For small applications, it is perfectly fine. But when an application becomes larger, it can cause some problems: More code: We need to pass the same props through multiple components. Difficult to maintain: Changing the data flow can become complicated. Unnecessary props: Some components receive data they don't actually use. 5. How Can We Avoid Props Drilling? React provides a feature called Context API. With Context API, we can share data between components without passing props through every intermediate component. Let's use createContext and useContext. App.jsx import { createContext } from "react";
import Profile from "./Profile";
export default App;
Here, we create a context and provide the username to the components inside the Provider. Profile.jsx import User from "./User";
function Profile() {
return ;
}
export default Profile;
Notice that Profile doesn't need to receive or pass the username anymore. User.jsx import { useContext } from "react";
import { UserContext } from "./App";
function User() {
const username = useContext(UserContext);
return
Welcome, {username}
;
}
export default User;
Now User can directly access the username using useContext(). We no longer need to pass the username through Profile. 6. Props Drilling vs Context API Props Drilling Context API Passes data through multiple components Shares data through a Provider Intermediate components pass props Intermediate components don't need to pass the value Useful for simple data flow Useful for data shared by many components 7. When Should We Use Context API? Context API can be useful when multiple components need the same information. For example: Dark Mode: Share the selected theme across components. Authentication: Share logged-in user information. Shopping Cart: Share cart information across different pages. Language Settings: Share the selected language. However, don't use Context API for every situation. For simple parent-to-child communication, normal props are usually enough.
Powered by Readybot.io
DEV Community
I Built a 100% Offline Resume Builder So I Wouldn't Have to Share My Phone Number & Email
Tired of spam calls and paywalled PDFs, I created PrivyResume—a local-first resume workbench that keeps your personal data strictly in your browser. Whenever you try to update your resume online, almost every website follows the exact same playbook: Let you spend 30 minutes typing out your entire career history. Force you to create an account with your email and phone number. Hit you with a surprise paywall right when you click "Download PDF." Sell or leak your contact details—leading to endless spam calls and shady recruiter messages. I got tired of handing over my personal phone number and email address to random databases just to generate a clean PDF. So, I built PrivyResume for my own use. What is PrivyResume? PrivyResume is a 100% client-side, offline-capable resume workbench. There are no user accounts, no backend databases, and zero tracking scripts. Here is how it works: Full Privacy First (Zero Servers): Your phone number, email address, and work history stay strictly inside your browser's localStorage. Nothing ever leaves your device or touches a server. Multi-Profile Support: Create and switch between multiple resume versions locally (for example, one tailored for Frontend roles and another for Full-Stack) right inside the browser. 1-Click Share Link: Need to send a live version quickly? Generate a shareable link with a single click. Export & Import via JSON: Because your data lives locally in your browser, you can download your resume as a raw .json file anytime to back it up or move it to another device. Free PDF Export & Print: Generate clean, print-ready PDFs with zero watermarks or paywalls. Built to Scratch My Own Itch I originally built this purely as a personal tool so I could keep my master resume backed up as a simple JSON file and export clean PDFs without worrying about data harvesting. If you are currently job hunting—or just want a fast, private way to maintain your resume without creating yet another account—give it a try here: Try PrivyResume I would love to hear your thoughts, feedback, or feature ideas in the comments!
Powered by Readybot.io
DEV Community
How I built a "chess-engine" style AI for a 6-dice strategy game natively on my Pixel 9 Pro
I just moved a solo project out of closed testing into production, and the engineering constraints almost broke me. The app is Maxi Yatzy Master, a digital version of the Scandinavian 6-dice variant of Yahtzee. The core game is completely free to play, but building a worthy AI opponent for it required solving a massive compute bottleneck. The Math Problem Standard 5-dice Yahtzee is largely luck-based, but the 6-dice variant allows players to bank unused rolls for later turns. This single mechanic creates incredibly complex diverging paths across different game states. Most mobile dice games use rigid logic trees or simply cheat the dice to simulate difficulty. Calculating the true optimal move required serious compute. To solve this, I built the game logic and probability statistics using a codebase architecture similar to advanced chess simulators. The AI is game-aware; it actively reads the opponent's scorecard and dynamically pivots its risk tolerance to maximize its actual win probability, rather than just chasing a raw high score. The Mobile-First Toolchain To make things harder on myself, I engineered the entire project natively on my phone. Local Environment: Built natively in the Claude Code app on Android. Multiplayer: Bypassed heavy matchmaking servers to build a lightweight, serverless Peer-to-Peer architecture using Firebase rules for online play. Deployment: GitHub, Cloudflare Pages, and Netlify. Feedback Engine: Built an offline analysis tool that flags mathematically suboptimal choices, tracks play themes, and allows players to jump back to replay specific turns. The Result It’s exactly the app I hoped it would be when I set out to build it, and it went through rigorous closed testing with a dozen real players to tune the mechanics. If any of you want to test out the AI's compute performance on your own device, or stress-test the Firebase P2P syncing, the app is live here: https://play.google.com/store/apps/details?id=com.maxiyatzy.trainer I’d love to hear your thoughts on the architecture, and I'm happy to answer any questions about the mobile-native workflow!
Powered by Readybot.io
DEV Community
SortMail Latest 🚀
Been quiet, but the building hasn't stopped! SortMail updates: ✅ Custom domain ✅ Professional support email ✅ Privacy Policy & Terms, FAQ & Support pages Now preparing for Google verification and public launch. 🌐 sortmail.online BuildInPublic
Powered by Readybot.io
DEV Community
Windows GUI check — published sentinel-ir-mcp 0.5.9
Verdict Source (GitLab, Apache-2.0): https://gitlab.com/jakubrojicek11/sentinel-ir npm: https://www.npmjs.com/package/sentinel-ir Playground (runs in your browser): https://sentinel-ir-playground-dc30c8.gitlab.io/ Desktop startup is verified; desktop-originated tool calls remain untested. Normally installed VS Code and its Cline extension both started the published server without signing in. Actual analysis calls passed through the MCP Inspector browser fallback, not a desktop client. VS Code also reproduced the reported Error/empty-output symptom, but on its session-bound server entry. The separate locally configured / Global in Code entry started successfully with the same configuration. Evidence points to VS Code's session/policy surface, not a broken Sentinel executable. The exact underlying VS Code policy requirement is not established. Environment and configuration Windows Server 2022; VS Code 1.146.0, official user installer, not portable. Onboarding bypassed with Continue without Signing In. No Microsoft/GitHub/Cline login. Primary runtime Node 22.23.5, secondary Node 24.22.2; spawned server ExecutablePath checked using Win32_Process, not inferred from shell PATH. Project: C:\t\Projekt Žluťoučký kůň\app; files src\index.js, src\util.js, src\main.rs, tool.py. Setup invoked as npx -y [email protected] setup --client vscode. It printed a command; it did not write configuration. Registered using the printed code --add-mcp form; resulting user configuration: %APPDATA%\Code\User\mcp.json. Actual running package: %LOCALAPPDATA%\npm-cache_npx\3ec5bc0582433d0b\node_modules\sentinel-ir-mcp\package.json → 0.5.9. Both Node versions used this published npm cache installation. VS Code's generated entry: {"type":"stdio","command":"npx","args":["-y","[email protected]","C:\t\Projekt Žluťoučký kůň\app"]}
For Cline and Inspector, copied the Windows JSON-client form confirmed by setup --client claude-desktop --project "" --config --dry-run: {"command":"cmd","args":["/c","npx","-y","[email protected]","C:\t\Projekt Žluťoučký kůň\app"]}
Verified results Client / surface Started? Tools / calls VS Code 1.146.0, local user entry, Node 22 Yes Running; Discovered 3 tools; real Sentinel Node 22 process. Initial restricted workspace worked; trusting it and restarting also worked. Cline 4.1.26, Node 22, generated cmd /c npx Yes Green connected indicator; schemas for analyze_code, analyze_file, analyze_directory. Calls untested: no configured working model. Selected local Ollama provider to finish onboarding without an account; no model service was installed. MCP Inspector 2.15.0 browser fallback, Node 22, same cmd /c npx Yes All three tools listed. Both required real calls passed; results below. VS Code 1.146.0, session-bound entry after relaunch, Node 24 environment No Error, empty MCP output; renderer: Could not list installed MCP servers. (refused: policy-context-unavailable). No additional Sentinel process from this attempt. Cline's separately running Node 24 server was not mistaken for this entry. VS Code 1.146.0, local / Global in Code entry, Node 24 Yes Same generated npx configuration; Running + Discovered 3 tools; separate actual Node 24 server process. VS Code local entry, Node 24, npx.cmd variant Yes Changed only command from npx to npx.cmd; Running + Discovered 3 tools. Original generated configuration restored afterward. Inspector calls: entered absolute Czech/spaced paths through visible tool forms and clicked Execute Tool. analyze_file on ...\src\index.js: OK, 75 ms in result pane; analysisStatus: complete, language: javascript, risk: medium, filesystem and network recognized (fs.readFileSync, https.get). analyze_directory on project root: OK, 39 ms; 4 analyzed, 4 complete, 0 incomplete, no timeout/truncation; Rust/Python critical (process spawning), index.js medium, util.js low. Protocol monitoring panel separately displayed approximately 73 ms / 34 ms for those calls. No C...
Powered by Readybot.io
DEV Community
I built a standup orchestrator that runs inside your AI agent (and doesn't spy on anyone)
When my team started writing standups with AI, three problems showed up: Loose updates. Everyone wrote in a different format, in a different place. No view of the team. Whoever read them had to stitch messages together. Nobody orchestrates. Nobody nudges who hasn't posted, and blockers sit until someone notices. Standcast fixes this by keeping the writing where people already work, in their agent, and handling the rest. The flow You run /daily in Claude Code (or use the MCP server in Cursor, Codex, Claude Desktop or VS Code, or the CLI). The daily opens with what you planned in the previous one and whether each item moved. Standcast drafts "yesterday" from real activity: pull requests opened, merged and reviewed, commits, Linear cards that moved and your Claude Code sessions, grouped by project in up to 5 lines. You edit it, write "today", blockers and support requests (what you need from someone without being stuck: a review, a decision, a pairing session) and confirm. The MCP submit tool requires confirmed: true, so the agent can't send it on its own. At the team's digest_at, a worker posts one digest per team to Slack or Google Chat: 🚧 blockers first, then 🤝 support requests. In the web app, Today shows the team's day: open blockers with their age, recurrence and a "probably resolved" hint when the PR already merged, support requests, today's dailies and what shipped yesterday. History keeps past digests, searches confirmed dailies and exports shipped work as Markdown or CSV. The parts that took real work AI sessions without leaking anything. The CLI reads the Claude Code session files on your machine, redacts secrets and hands only a summary to the agent. No session data reaches the API: only the daily text you confirm. Configuration as code. A standcast.yml in the organization's .github repository, which you can also edit through a form in the web app. Every push that changes the file gets a check run with the error on the right line, and an invalid push never breaks anything: the last valid version keeps working. Routing blockers. A blocker that mentions a pull request goes by DM to its reviewers, then CODEOWNERS, then the team's managers. On Linear, to the owner of the blocking card. If it is still open after N days, the team gets one alert. Sending exactly once. Every message goes through a database claim with a fencing token before it reaches the chat. A job retry never sends twice. Time zones and workdays. remind_at and digest_at are local times of the team; Monday covers the weekend. The rule I won't bend No per-person metrics, no rankings, no history of who didn't post. "Who hasn't posted yet" exists only for today, in the web app. Standcast also suggests blockers (a PR waiting for review, CI red for a day, a card stuck in progress), but those suggestions belong only to the person: they never show up in the digest, the API, webhooks or for the manager. A CI test makes sure of it. Stack Bun, strict TypeScript, Hono, Postgres with Drizzle, pg-boss for queues, a GitHub App, Slack, Google Chat and Linear. The CLI is a single binary with the MCP server built in. The web app is React 19 with TanStack Router and ker. MIT. Open beta It's in free beta and I'm looking for teams of 3 to 15 people on GChat. If you want to try it, leave a comment or open an issue and I'll help you set it up. Site: https://standcast.app Repository: https://github.com/ImFelipeOliveira/standcast Docs: https://docs.standcast.app Feedback is welcome.
Powered by Readybot.io
DEV Community
Estimating Proxy Bandwidth for Public Data Collection in Kazakhstan with Python
Collecting public data responsibly is not only a question of writing faster code. Before increasing concurrency, you need to estimate the traffic volume, the available time window, retry overhead, and the throughput your workload can actually sustain. This guide builds a small Python model for that calculation. It is intended only for requests you are authorized to make. Respect applicable law, the target website's terms, robots directives, and rate limits. 1. Start with the theoretical minimum For decimal terabytes, the average throughput required to transfer a given volume is: required_Mbps = traffic_TB × 8,000,000 ÷ seconds
seconds = days × 86,400
For example, moving 100 TB evenly over 30 days requires: 100 × 8,000,000 ÷ 2,592,000 = 308.6 Mbps
That is only the theoretical average. It assumes continuous transfer, no retries, no pauses, and no protocol overhead. 2. Add utilization and retry overhead A practical estimate should reserve capacity for variable latency, connection setup, retries, and quiet periods. The function below makes those assumptions explicit. from dataclasses import dataclass
SECONDS_PER_DAY = 86_400
BITS_PER_TERABYTE = 8_000_000 # Mbps-seconds in one decimal TB
@dataclass(frozen=True)
class BandwidthEstimate:
theoretical_mbps: float
planned_mbps: float
def estimate_bandwidth(
traffic_tb: float,
days: int,
utilization: float = 0.70,
retry_fraction: float = 0.10,
) -> BandwidthEstimate:
if traffic_tb <= 0:
raise ValueError("traffic_tb must be positive")
if days <= 0:
raise ValueError("days must be positive")
if not 0 < utilization <= 1:
raise ValueError("utilization must be between 0 and 1")
if retry_fraction < 0:
raise ValueError("retry_fraction cannot be negative")
estimate = estimate_bandwidth(traffic_tb=100, days=30)
print(estimate)
With 70% utilization and 10% retry overhead, the result is approximately: BandwidthEstimate(theoretical_mbps=308.6, planned_mbps=485.0)
The gap between 308.6 Mbps and 485.0 Mbps is not wasted bandwidth. It is operational headroom for a workload that does not run perfectly every second of the month. 3. Compare the result with standard throughput levels The following table shows the maximum theoretical transfer volume when a connection runs continuously at the listed rate. Throughput 1 day 7 days 30 days 100 Mbps 1.08 TB 7.56 TB 32.4 TB 200 Mbps 2.16 TB 15.12 TB 64.8 TB 400 Mbps 4.32 TB 30.24 TB 129.6 TB 600 Mbps 6.48 TB 45.36 TB 194.4 TB 800 Mbps 8.64 TB 60.48 TB 259.2 TB 1 Gbps 10.8 TB 75.6 TB 324 TB For the 100 TB example, 400 Mbps covers the theoretical average but leaves limited room for retries and idle periods. A 600 Mbps tier provides more practical headroom under the assumptions above. 4. Measure latency instead of guessing A bandwidth plan alone does not guarantee application throughput. Measure representative endpoints before selecting concurrency. import statistics
import time
import requests
Use an endpoint you control or have permission to test. Do not benchmark a third-party website aggressively. P95 latency ...
Powered by Readybot.io
DEV Community
SQL COUNT After a LEFT JOIN: Why Zero Orders Can Become One
A customer with no orders can accidentally receive an order count of one. The SQL runs successfully; the error is in what is being counted. A minimal PostgreSQL example WITH customers(customer_id) AS (
VALUES (1), (2)
), orders(order_id, customer_id, status) AS (
VALUES (101, 1, 'paid'),
(102, 1, 'pending')
)
SELECT c.customer_id,
COUNT() AS joined_rows,
COUNT(o.order_id) AS order_count,
COUNT(o.order_id) FILTER (WHERE o.status = 'paid')
AS paid_order_count
FROM customers AS c
LEFT JOIN orders AS o
ON o.customer_id = c.customer_id
GROUP BY c.customer_id
ORDER BY c.customer_id;
Expected results by inspection: customer_id joined_rows order_count paid_order_count 1 2 2 1 2 1 0 0 The left join preserves customer 2 with null values for the missing order columns. COUNT() counts that result row. COUNT(o.order_id) counts only non-null order IDs. The distinction matters because order_id is assumed non-null for every real order. This query is illustrative and has not been executed against a database for this post. Run it in a development environment before adapting it. Keep the population you intended Adding this condition after the join changes the question: WHERE o.status = 'paid'
It removes rows where the right-hand status is null, so customers without a matching paid order disappear. That may be correct for “customers who paid,” but not for “all customers and their paid-order counts.” To retain all customers, either keep the conditional aggregate shown above or restrict the join itself: LEFT JOIN orders AS o
ON o.customer_id = c.customer_id
AND o.status = 'paid'
Then count the non-null order key. These are alternative query shapes, not instructions to paste both joins into the same statement. Check the assumptions before trusting the count The customer input should have one row per customer for this report. Duplicate left-hand keys multiply matches. Count a right-hand column guaranteed non-null for a real match. A nullable description is not an order counter. Joining order items afterward changes the grain again. Aggregate or validate that relationship before interpreting rows as orders. COUNT(DISTINCT order_id) can express a distinct-order metric, but it can also conceal a mistaken join. Explain the metric before reaching for it. Test one customer with no orders, one with only pending orders and one with several paid orders. Verify that every intended customer remains present and that zero means zero matching orders, rather than a missing source feed. References: PostgreSQL aggregates and table expressions and outer joins. Saravana Kumar | TechX Personal website · Instagram AI disclosure: Original tutorial generated by an AI assistant without human editing. Results are reasoned expectations, not a claim of database execution.
Powered by Readybot.io
DEV Community
Why was this 837 rejected? Tracing 999 and 277CA responses back to the claim
A claim batch went out three months ago. Some claims were paid, some were denied, and a few simply never came back. No remittance, no denial, nothing. Before anyone calls the payer, there is a cheaper question: did those claims ever get past the front door? Two files answer that, and neither one looks like a remittance: the 999, which says whether a whole transaction set (one ST/SE block of claims) was accepted, and the 277CA, which reports claim by claim whether each one was accepted or rejected before adjudication. A claim rejected at either stage never produces an 835. So "no remit" and "rejected" look the same in your aging report unless you connect the files. This post shows how to do that by hand, then with a free CLI I wrote. Everything below uses synthetic files. What a rejection looks like on the wire A 999 answers one 837 transaction set at a time. Each set gets an AK2 segment naming it (the transaction type and the ST control number from your file), then an IK5 segment with the verdict. Optional IK3/IK4 segments point at the segment and element that failed. This is a synthetic 999 where I rejected the second set: AK1HC1005010X222A1~
AK28370001005010X222A1~
IK5A~
AK28370002005010X222A1~
IK3CLM1423008~
IK4210287NOTAVALIDID~
IK5R5~
AK28370003005010X222A1~
IK5A~
...
AK9P554~
IK5A is accepted, IK5R is rejected, and AK9P says the group was only partly accepted: 5 sets received, 4 accepted. The whole second set, all its claims, was bounced. A 277CA works at the claim level. Each claim gets a TRN segment carrying your patient control number (the CLM01 you sent), followed by an STC status segment: TRN2PCN00000032~
STCA3:2120260102U224.56~
The first element of STC starts with a category code (here A3). Which categories mean "rejected" depends on your payer's companion guide, so check yours. x12diff treats A3, A4, A6, A7 and A8 as rejections by default and A0, A1 and A2 as acceptances, and both lists are configurable in the profile. The by-hand method Open the 999. For every AK2 with an IK5R, note the ST control number. In your 837 file, find the set with that ST02. Every CLM between that ST and its SE was in the rejected set. Open the 277CA. Collect every TRN02 whose STC category is a rejection. Those are claim IDs, which are CLM01 from the 837. Remove all of those from your "unpaid" list. What is left really is waiting on the payer. That works for one batch. It stops working when you have a month of files, several sets per file, and resubmissions that reused control numbers. Which brings the first trap. Trap: control numbers are not unique ST02 and GS06 are only unique inside their interchange. If you start numbering at 1 in every file, a 999 for ST02 = 0002 could belong to a dozen different 837s. Matching safely needs more than the number: the group control number, the version string, the date, and who sent it. Being sure which file a 999 answers is the hard part, not reading the IK5. Also: a 277CA acceptance can arrive after an earlier rejection (you fixed and resent the claim). The newest status should win. If you just take the first STC you see, you flag claims that are fine. Doing it with x12diff x12diff is a free command-line tool for 834, 835, 837 and the acknowledgement files. Disclosure: it is mine, it is MIT licensed, and it runs entirely offline. There is a paid desktop version planned, but everything in this post is the free CLI. Give recon the 837, your 835s, the 999 and the 277CA in any order. It recognizes each file by its contents: $ x12diff recon claims.837 remits_1.835 remits_2.835 ack.999 status.277 --asof 20260601 --csv recon.csv --show 0
Files: 5 837 claims: 200 in 5 sets 835 claim entries: 185 on 3 checks
Acknowledgement sets: 1 (1 837 sets rejected) 277CA claim statuses: 26
PAID: 99
PARTIAL: 37
DENIED: 14
PATIENT_RESP: 9
REVERSED: 8
ADJUSTED: 3
UNMATCHED: 18
REJECTED: 12
ORPHAN: 1
Charged (837): 50866.73 Paid (m...
Powered by Readybot.io
DEV Community
Dream Cycle: a chat that remembers, then sleeps
I built Dream Cycle for the HydraDB Hackathon. It is a chat that saves every message as a memory in a HydraDB graph. Then you press Sleep, and it cleans the memory: it merges duplicates, drops small talk, and rewrites contradictions. Ask the same three questions before and after Sleep, and the answers get better. What I built Dream Cycle is a simple web app. You chat with it, and every message becomes a memory. I seeded it with 200 fake memories: 120 duplicates, 40 bits of noise, and one contradiction. The contradiction is the point. One memory says "I love coffee." A newer one says "You quit coffee." Before Sleep, the app answers "Do I like coffee?" with the old line. After Sleep, it answers "You quit coffee." That is the whole demo in one flip. How HydraDB helped I used HydraDB's open-source graph engine, self-hosted. Every memory is a real (:Memory) node in the graph, not a row in a table. Every read and write is real Cypher over the graph's HTTP API. Sleep is not a filter on a list. It runs Cypher to find duplicate memories, merge them, drop the noise, and write the cleaned version back as a node. The memory count drops from 200 to 39, and the graph does the work. I also worked with selfgraph, HydraDB's temporal memory library, for the $50 side bounty. I audited it and found a real bug: when you restore a source, the old text comes back in historical reads, even for times when the replacement was the true text. Finding that bug taught me how the temporal layer is supposed to work, and it made the Dream Cycle design sharper. The technical challenges, and how I solved them No free hosted workspace. The HydraDB dashboard only showed paid plans, and there were no free credits for the hackathon. The answer from Discord was to use the open-source engine. So I built the graph-node from source. It needs Rust, a Cypher parser library, and GraphBLAS, and the compile takes a while. Once it was running, I had a real graph database on my own machine. No semantic search. The open-source build has no embeddings, so retrieval is Cypher over stored text, word match, not meaning. I did not pretend otherwise. The demo works because the memories are exact text and the questions match them. The Render deploy kept failing. The first build failed because an install script needed a folder name. The second failed because the Rust build needed a feature flag called server-runtime, or the binary would not compile at all. I fixed both lines in the Dockerfile, redeployed, and the app went live. The binary was too big to push. The compiled graph-node is 74 MB, and the GitHub API refuses files that large. So the Dockerfile builds it from source at a pinned commit instead of shipping the binary. A race bug. The page loading twice seeded the database twice. I added a lock so only one seed can run at a time. The video. Loom's free account cannot upload a pre-recorded video, so I am sorting a different link for the demo video. What I would be honest about Only the coffee answer flips. The memory map is a row of dots, not a real graph picture. Sleep is one-shot, you reset before a fresh run. But the core works end to end: 200 memories in, Sleep, 39 out, and the answers improve. That is what I set out to prove. Links Live app: https://dream-cycle.onrender.com/ Repo: https://github.com/skymiller1509-blip/dream-cycle The demo video is in the repo under demo/dream_cycle_demo.mp4. @hydra_db
Powered by Readybot.io
DEV Community
Retrieval Architecture for Engineering Docs: Versioning and Freshness Boundaries
Short answer: use staged retrieval with explicit collections, bounded queries, and traceable source context. Infrai is a useful fit for the collection and query stages when a self-describing REST contract keeps a small tool moving. For internal engineering documentation that contains near-duplicate media records, versioning and deletion rules matter more than picking a fashionable vector index. I build CLIs and SDK glue for other developers. My first benchmark is time-to-first-call, then I measure the boring things: stale-hit rate, p95 query time, and how often a citation points at the wrong revision. A retrieval demo can look perfect while an old runbook still wins against the current one. That is a data-handling failure, not a ranking mystery. What should a retrieval architecture for internal engineering documentation version? Start with a retrieval contract. Each chunk needs a stable document id, a revision id, source URI, effective timestamp, and deletion state. The query contract returns the chunk plus that context, so the answer layer can show exactly which revision it used. Keep the user-visible answer mapped to this contract before choosing storage. For the media workflow, I put near-duplicate records in an explicit collection for the corpus and keep revision metadata alongside each vector. A changed transcript creates a new revision. The indexer then marks the previous revision inactive and removes deleted records from the collection. “Overwrite in place” is tempting; it also makes an audit trail disappear. In practice, a release can change a title, transcript, rights flag, and region at different times; the ingestion job therefore records each source event, derives one revision key, checks that every chunk carries the same key, and only then switches the query filter. That extra bookkeeping feels slow on day one, but it prevents a mixed answer assembled from two incompatible revisions. Region and processor boundaries belong in the contract too. The retrieval service can select a collection and enforce metadata filters, but it cannot grant a provider permission to retain source audio or satisfy a residency clause. Keep raw media in the system that owns those agreements. Send only the text or embeddings that the contract permits, and record the processor and region decision with the ingestion event. One sentence that keeps the design honest: retrieval can enforce which indexed revision is eligible; it cannot turn an unapproved processor into an approved one. Ship the contract first. A small build log: chunk, index, query Chunking is the decision axis here. Split engineering documents at headings and version boundaries, then keep a small overlap for references that cross a boundary. For media-derived records, a chunk should carry the recording id and transcript revision, not just a blob of text. Near-duplicates become distinguishable when the metadata says which revision and capture window produced them. The first pass is bounded and filtered. Query the collection for a modest candidate count, then compare semantic similarity and revision freshness in a second stage. Never run a global top-20 and filter access afterward; the intermediate component would already have seen records outside its trust boundary. Below is the transport skeleton I use in a TypeScript CLI. The payload objects are validated against the live discovery schemas before this function is called. That keeps the sample runnable without inventing request fields, while the helper still handles explicit methods, timeouts, status checks, and 429 backoff. const baseUrl = "https://api.infrai.cc/v1";
const apiKey = process.env.INFRAI_API_KEY;
if (!apiKey) throw new Error("INFRAI_API_KEY is required");
Chrome Zero-Day CVE-2026-125350: How to Update Chrome and 6 Checks for Extension Developers
Updating your own Chrome takes a minute. The part that takes longer is every other Chrome you forgot you have. None of this is a reason to ship anything in a hurry. You read the headline between two tasks. Another Google Chrome zero-day, already used in attacks. You open the menu, see a small "Relaunch" button, think "later", and go back to your code. The laptop stays open for the rest of the week. CVE-2026-125350 is a high-severity Chrome vulnerability: a memory bug (a "use-after-free") in the part of Chrome that reads XML. Google fixed it with a Chrome security update on 9 November 2026, in Chrome 157.0.8103.50 for Linux and 157.0.8103.50/.51 for Windows and Mac, and wrote one short line about it: an exploit for this bug exists in the wild. The security press counts it as the eighth Chrome zero-day used in attacks this year. A smaller question helps more than the headline: how many copies of Chrome do you really run? For an extension developer the answer is rarely one. Go through the list in order. The first four are checks for today; the last two are for the rest of the week. 1. Check your Chrome version "I have auto-update" is a setting, not a version number. If you are asking "what version of Chrome do I have?", open this page and read the number: chrome://settings/help
On Linux the terminal shows the installed build (the running one may still be older until you restart): google-chrome --version
There is one more detail. On 11 November Google shipped a second update, 157.0.8103.78 (.79 on some Windows and Mac machines), with 83 more security fixes, five of them rated Critical. So the fix for the zero-day is in .50, but the latest Chrome version at the time of writing is .78, and that is the number you want to see. 2. Update Chrome, then relaunch it How to update Chrome: open Help → About Google Chrome and wait for the download to finish. On Windows and Mac, Chrome usually does this by itself in the background; on Linux the update arrives with your system updates. It starts using it only after a restart. A downloaded update protects nobody while the old browser is still running. Developers are a bad case here. We keep one window open for days, with forty tabs. Picture a freelance developer whose Chrome downloaded the update on Monday. They never closed the window, so on Friday they are still on the old build. Click "Relaunch". 3. Count the other Chromes on your machine This is the step that took me the longest. On my work machine I found more browsers than I expected: Chrome Beta and Canary, which I use to test upcoming changes an old portable copy in a folder for reproducing bug reports the browser that my test tool downloaded for itself The last one is easy to forget. Automation tools such as Playwright and Puppeteer download their own browser build. It does not update with your Chrome. It changes only when you update the tool. This part is a guess: I have not seen an official statement about these builds and this bug. They are built from the same code, so I treat an old one as unpatched. Check which browser version the tool ships, update the tool when a release with 157.0.8103.50 or later is out, and until then do not use that browser to open pages you do not control. 4. Check the other browsers your extension lives in If you publish in more than one store, you also run more than one browser. Each of them ships the fix on its own schedule. Edge. Microsoft's release notes say Edge 157.0.4341.46, released on 9 November, contains the fix. Brave, Opera, Vivaldi. I did not find a clear statement for each of them, so I give no version numbers here. Open the "About" page in each browser and read the vendor's release notes. Firefox uses a different engine. I found no report that it is affected. 5. Watch your store numbers for a week, and do not ship in a panic Google describes it as a bug in the browser itself. Nothing I read says extension code needs to change because of it. An emergency release "just in case" brings mor...
Powered by Readybot.io
DEV Community
Adding Git repo & test into Rust Studio IDE
Ruststudio is a free IDE for Rust that is itself written in Rust: one native program of about 10 MB, Version 0.1.6 moves three things into the editor that used to need a terminal: Git, running single tests, and adding packages. This post is less a feature list (the release article has that) than the three design decisions I would defend, and the places where I am not sure I got it right. Decision 1: do not implement Git, run it The obvious route is a Git library. I chose to run the git the user already has, for one reason: a Git panel is only trustworthy if it does exactly what git in the terminal would do. Hooks run. .gitconfig applies. Your credential helper signs you in, which means the IDE never sees, asks for or stores a password. When Git refuses, the panel shows Git's words and does not retry with a force flag. The cost is that you depend on Git's output, and you have to be careful with names (spaces, non-English letters, renames, binary files). The payoff is that everything the panel does is something you could have typed yourself, including staging one hunk or only the lines you click. One more rule I stuck to: the view never polls. It refreshes when something happens (a command, a save, a build, coming back to the window). A timer that runs git status every second looks responsive in a demo and punishes large repositories. Not done: a side-by-side diff, stash, interactive rebase, a commit graph. The Terminal does those, and it is the same Git. Decision 2: the test list comes from Cargo, not from my parser Finding tests by scanning source for #[test] is easy and wrong: macros generate tests, attributes differ (#[tokio::test], #[rstest], #[test_case]), and doc tests are not functions at all. So there are two sources, used for different jobs: The margin icons come from the source, so they appear as soon as a file is open, with no build. They are a convenience and they recognise the common attributes. The Test Explorer shows what Cargo reports (package, test binary, module, test, doc tests, ignored tests), so it can disagree with the margin when macros are involved, and when it does, Cargo is right. Running is your own cargo test with the toolchain and configuration you chose. Results are shown per test while the run is still going, and a failure gets its panic message and file:line under it and an entry in the Problems panel, so a failing test reads like a compile error. Debugging a test builds the test program and starts it under the debugger with that one test selected, so breakpoints in the test and in the code it calls are hit. (On Windows with the MSVC toolchain this uses PDB symbols through lldb-dap.) Known gaps: no coverage, no per-test timing, doc tests can be run but not debugged, and tests generated by macros get no margin icon. Decision 3: hints from rust-analyzer, shown but never written Inlay hints (the type after a let, the parameter name at a call, the types along a method chain) are drawn dim inside the code. They are not part of the buffer: the caret steps over them, they cannot end up in a diff, and View > Toggle Inlay Hints turns them off. The same mechanism shows variable values at the end of the lines while the debugger is stopped. One thing I noticed while taking these screenshots: on one machine rust-analyzer could not resolve the standard library and showed {unknown} for some types. The hints are only as good as what rust-analyzer resolves, and I would rather say so than choose only the screenshots that look perfect. Also in 0.1.6 Package sources you can add (any NuGet V3 feed or Cargo sparse registry, alongside nuget.org, crates.io and the Ruststudio registries), publishing to rupm or NuGet from the IDE with a confirmation that says publishing is public, and Go to Implementation (Shift+Alt+F12). Native iOS apps are in development and are not part of this release.
Powered by Readybot.io
DEV Community
How to Write a README That Explains Your Project in 30 Seconds
Most people who open your README are deciding whether to read it. They came from a search result, a link in an issue, or a dependency list, and they will give the page a few seconds. In that time they want three answers: what is this, is it for me, and how do I try it. A README that answers those three in its first screen does most of its work before anyone scrolls. This article is a structure for that first screen, with an example built around a small command line tool, and the parts that belong further down. The tool, logtrim, is invented for this article; the commands show the shape of a README, not a real package. What does a stranger need first? Think of the reader who has never heard of the project. They do not know your internal names, the history of the repository, or why it was started. They know their own problem. So the first screen answers, in order: What it does, in one sentence, in words the reader would use for their own problem. Who it is for, or the situation where it helps. What using it looks like, as the shortest real example. How to install it, as one command if possible. Everything else (configuration, architecture, contributing, the changelog, the badges) is for people who already decided to stay. The one-sentence description The first sentence is the hardest and the most important. A useful test: could someone who has the problem recognise it in your sentence without knowing your field's vocabulary? Weak versions describe the implementation or praise it: A fast, modern, extensible CLI built with Rust for working with log files. This says what it is made of and how the authors feel about it. It does not say what happens when you run it. A stronger version describes the result: logtrim cuts large log files down to the lines that matter: the errors and the lines around them. The reader now knows whether this is their problem. If they do not have large log files, they can leave, and that is also a good outcome. Show the shortest real example After the sentence, show it working. Not a full tutorial: one input and one output, copied from a real run. $ logtrim app.log --context 2
[12:04:11] INFO request started id=8812
[12:04:11] INFO calling payment service
[12:04:12] ERROR payment service timeout after 5000ms
[12:04:12] INFO retry 1 scheduled
[12:04:13] INFO retry 1 ok
A reader understands an example faster than a list of features, because they can see the shape of the result and compare it with their own case. Keep the example small enough to fit on the screen with the description above it. If the real output is long, cut it and say so in a comment. Install in one line, then point onward cargo install logtrim
If installation needs more than one step, put the most common path here and link to the full instructions further down. The first screen is for trying, not for every operating system. Before and after Here is a typical README opening, shortened: # logtrim
[badges: build, coverage, version, license, downloads]
logtrim is a modern, blazing fast log processing toolkit. It was started in 2023 to solve problems we had at work and has grown into a flexible framework with plugins, multiple output formats and a configuration system.
Table of contents
...
A stranger reads the badges, a history, and adjectives, and still does not know what the tool does to a log file. The same opening, rewritten: # logtrim
logtrim cuts large log files down to the lines that matter: the errors and the lines around them.
Useful when a log is too long to read and grep shows the error without its context.
(example run)
(install command)
Nothing was invented. The facts were already in the old version; they were in the wrong order and hidden behind words that describe the authors rather than the tool. What goes further down Once the first screen is right, the rest of the README can be ordered by how often people need it: Usage: the common options, each with a short example. Configuration: only if there is any. How it wo...
Powered by Readybot.io
Announcements
Share your community's updates and events to help potential members discover your server's activity and culture.
You might also be interested in
External Link
Platform
You are about to visit:
https://example.com
This will open in a new tab. Make sure you trust this link.
Want your members to see this?
Pick a channel for upvote and positive review notifications so your members can celebrate together.
It looks like our bot has been removed from your Discord server. To continue using CommunityOne features, you'll need to re-invite the bot to your server.
Don't worry! Re-inviting the bot will restore all your previous settings and data.





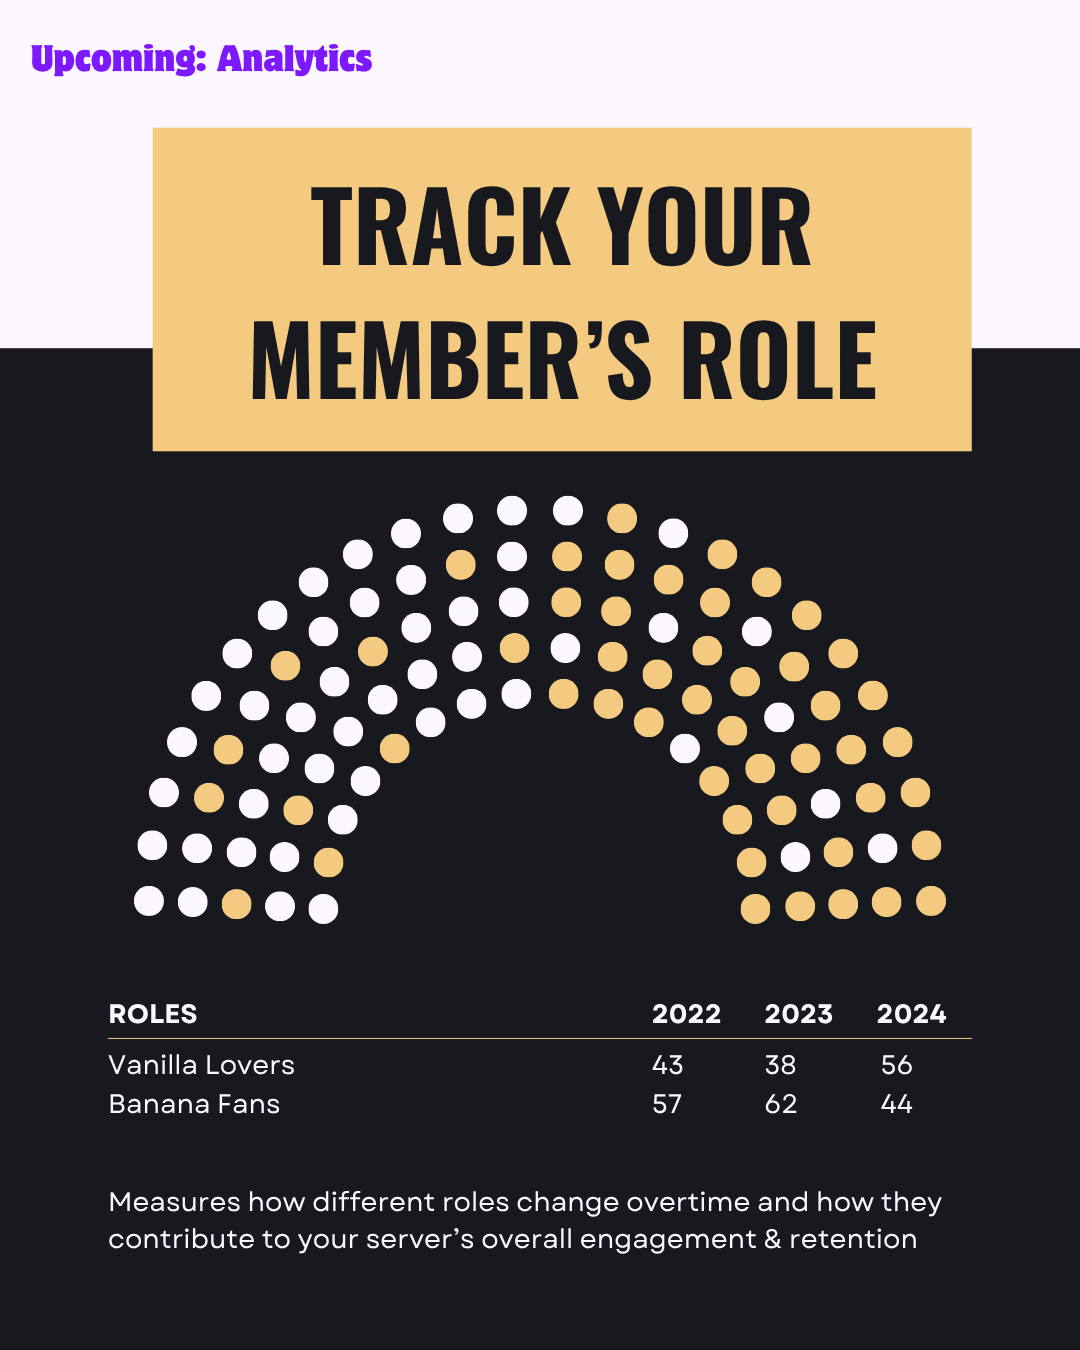



External Link
Platform
You are about to visit:
https://example.comThis will open in a new tab. Make sure you trust this link.