BAC RSI Explained: Gains, Losses, and Wilder Smoothing
Summary
Hollow Point Trading shares a short explainer on how RSI measures the size of gains and losses rather than counting winning candles. It walks through a historical Bank of America IEX example using completed five-minute closes, 14-period averages, and Wilder updates—useful context for interpreting RSI signals.
https://youtu.be/Mcle-5aOv9w
BAC RSI: count the size of gains and losses, not winning bars #Shorts
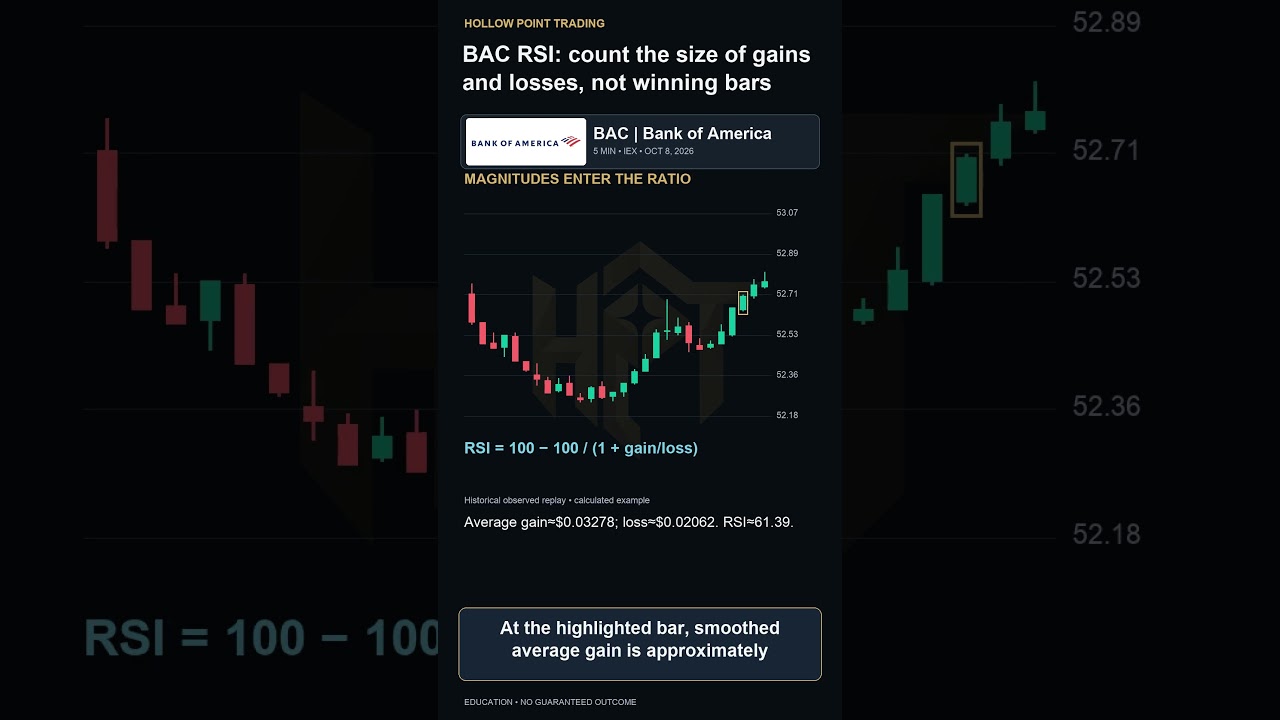
RSI does not count the percentage of winning candles. This historical Bank of America IEX example uses completed five minute closes from October eighth, twenty twenty six. We seed fourteen period average gains and losses with the first fourteen changes, then use Wilder updates. At the highlighted bar, smoothed average gain is approximately zero ...