Hollow Point Trading
Hollow Point Trading Discord server banner

Hollow Point Trading Updates & Events

Server Updates & Events

Announcements

JPM ADL Explained: Negative Increments Aren’t Outflows

https://youtu.be/gmOg0bynbyE

JPM ADL: a negative increment is not dollars leaving the stock #Shorts


A negative accumulation distribution contribution is not measured dollars leaving a stock. This historical JPMorgan IEX replay uses a completed five minute bar from October eighth, twenty twenty six. Its high is three twenty nine point four seven; its low is three twenty eight point eight one. The close is three twenty nine point zero seven. It ...

JPM ADL Explained: Negative Increments Aren’t Outflows

Costco ATR: How Wilder Smoothing Remembers Ranges

https://youtu.be/QYL8EaYWMxw

COST ATR: Wilder smoothing remembers earlier ranges #Shorts


Two fourteen period ATR readings can differ because their smoothing differs. This historical Costco IEX example uses completed five minute bars from October eighth, twenty twenty six. We seed Wilder smoothing with the first fourteen available true ranges, then update recursively. Before the highlighted bar, the smoothed range is approximately on...

Costco ATR: How Wilder Smoothing Remembers Ranges

JNJ ROC Explained: Why 12 Periods Need 13 Closes

https://youtu.be/TISW0dRmxAQ

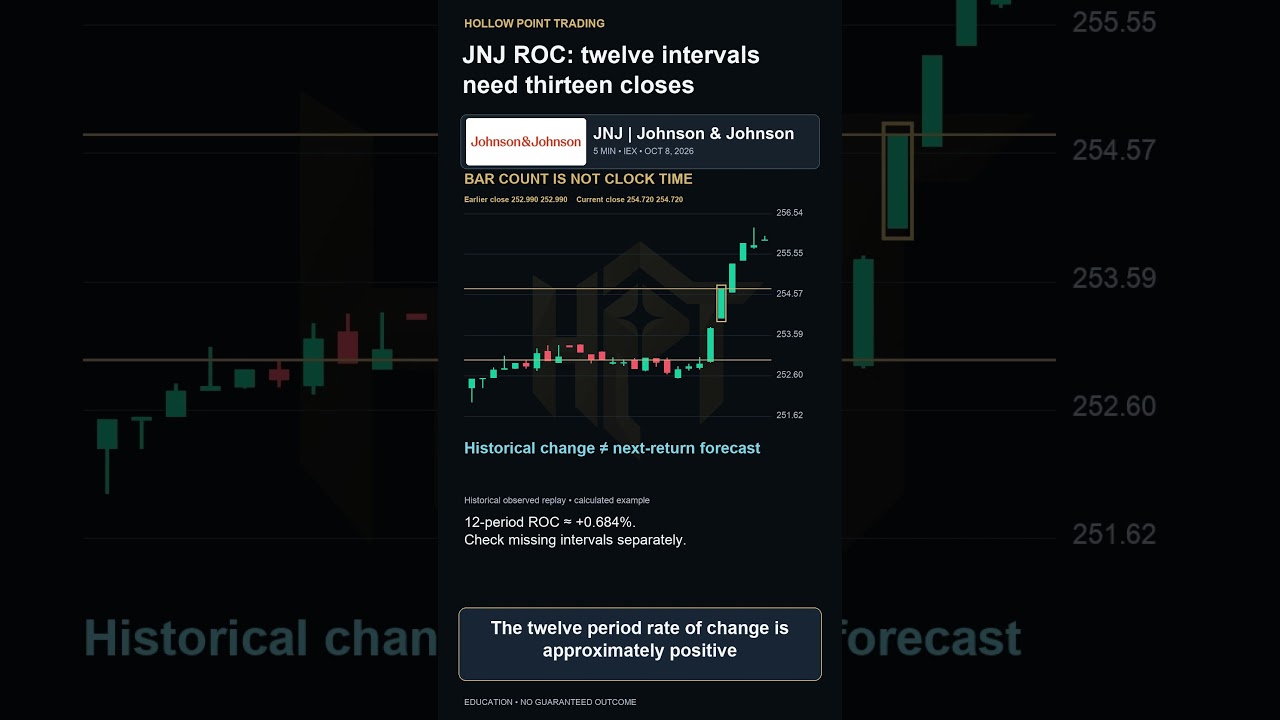
JNJ ROC: twelve intervals need thirteen closes #Shorts


A twelve period rate of change needs a current close and a close twelve bars earlier. That is thirteen closing observations, not twelve. This historical Johnson and Johnson IEX replay uses completed five minute bars from October eighth, twenty twenty six. The highlighted close is two fifty four point seven two. Twelve bars earlier, the close was...

JNJ ROC Explained: Why 12 Periods Need 13 Closes

BAC Aroon Explained: Recency vs. Price Movement

https://youtu.be/hTQ8Oal21dw

BAC Aroon: recency is not the size of a price move #Shorts


Aroon measures how recently an extreme occurred, not how many dollars price moved. This historical Bank of America IEX replay uses fourteen completed five minute bars from October eighth, twenty twenty six. We declare a fourteen bar window including the highlighted bar. The window high is fifty two point seven one, on the current bar. Zero bars ...

BAC Aroon Explained: Recency vs. Price Movement

GOOGL CCI Explained: Mean Deviation vs. Standard Deviation

https://youtu.be/FzrnVSszN9Y

GOOGL CCI: mean deviation is not standard deviation #Shorts


The denominator in this CCI example is mean absolute deviation, not standard deviation. This historical Alphabet IEX chart uses five minute bars from October eighth, twenty twenty six. We explicitly choose typical price: high plus low plus close, divided by three. Across twenty completed bars, average typical price is approximately three forty n...

GOOGL CCI Explained: Mean Deviation vs. Standard Deviation

XOM Williams %R Explained: Measure Distance from the High

https://youtu.be/7Fr-J3uTxh4

XOM Williams percent R: measure distance from the window high #Shorts


A negative Williams percent R reading is not a negative stock return. This historical Exxon Mobil IEX example uses fourteen completed five minute bars from October eighth, twenty twenty six. The window high is one sixty nine point zero three five. The low is one sixty seven point two five. The highlighted close is one sixty seven point eight two...

XOM Williams %R Explained: Measure Distance from the High

DE Donchian Breakout: Exclude the Test Candle

https://youtu.be/BTZPw5jabxw

DE Donchian breakout: exclude the test candle from the threshold #S...


A breakout test needs a threshold that does not move with the candle being tested. This historical Deere IEX example uses five minute bars from October eighth, twenty twenty six. The highest high of the twenty completed bars before the highlighted candle is six forty six point three five five. The highlighted candle closes at six forty eight poi...

DE Donchian Breakout: Exclude the Test Candle

MSFT Moving Average: Why the Outgoing Close Matters

https://youtu.be/tmFtL8dkZSs

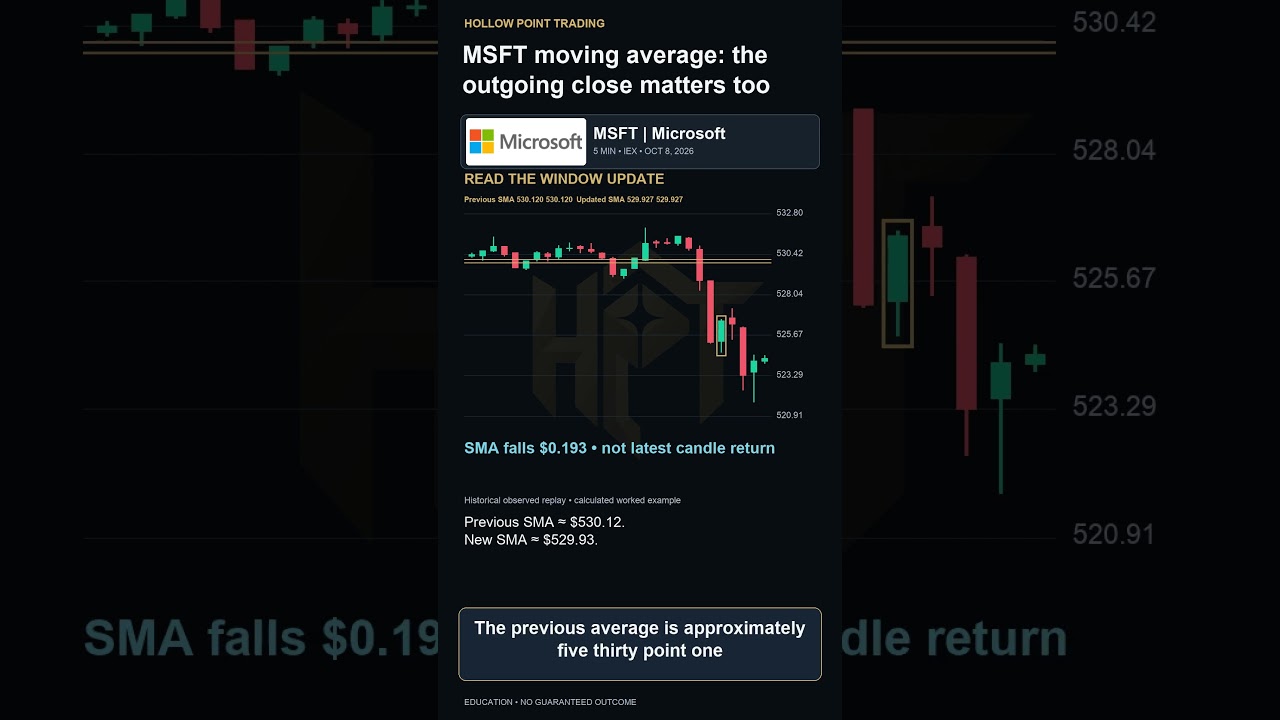
MSFT moving average: the outgoing close matters too #Shorts


A simple moving average changes when one close enters and another leaves. This historical Microsoft IEX example uses five minute bars from October eighth, twenty twenty six. For the highlighted twenty close average, the incoming close is five twenty six point five two. The outgoing close is five thirty point three eight. The other nineteen close...

MSFT Moving Average: Why the Outgoing Close Matters

Good-Till-Canceled Orders: When They Expire

https://youtu.be/wBF0BMylvNU

Good till canceled does not always mean forever #Shorts


A good till canceled order can still expire under your broker rules. Imagine an unfilled buy limit left open after your original reason for buying has changed. Persistence is an instruction about duration, not proof that the trade still makes sense. Unlike a day order, a supported good till canceled order can remain across trading days. But brok...

Good-Till-Canceled Orders: When They Expire

JNJ Pivot Highs: Handling Equal Prices

https://youtu.be/Oj73_jKbpCA

JNJ pivot highs: decide how equal prices are handled #Shorts


Two equal highs can expose an unstated rule in your swing detector. This historical Johnson and Johnson IEX replay uses five minute candles from October eighth, twenty twenty six. Four consecutive highs are two fifty six point six zero, two fifty six point eight one, two fifty six point eight one, and two fifty six point seven nine. Define a str...

JNJ Pivot Highs: Handling Equal Prices

Immediate or Cancel Orders: Why Partial Fills Happen

https://youtu.be/bsbqflDY4KM

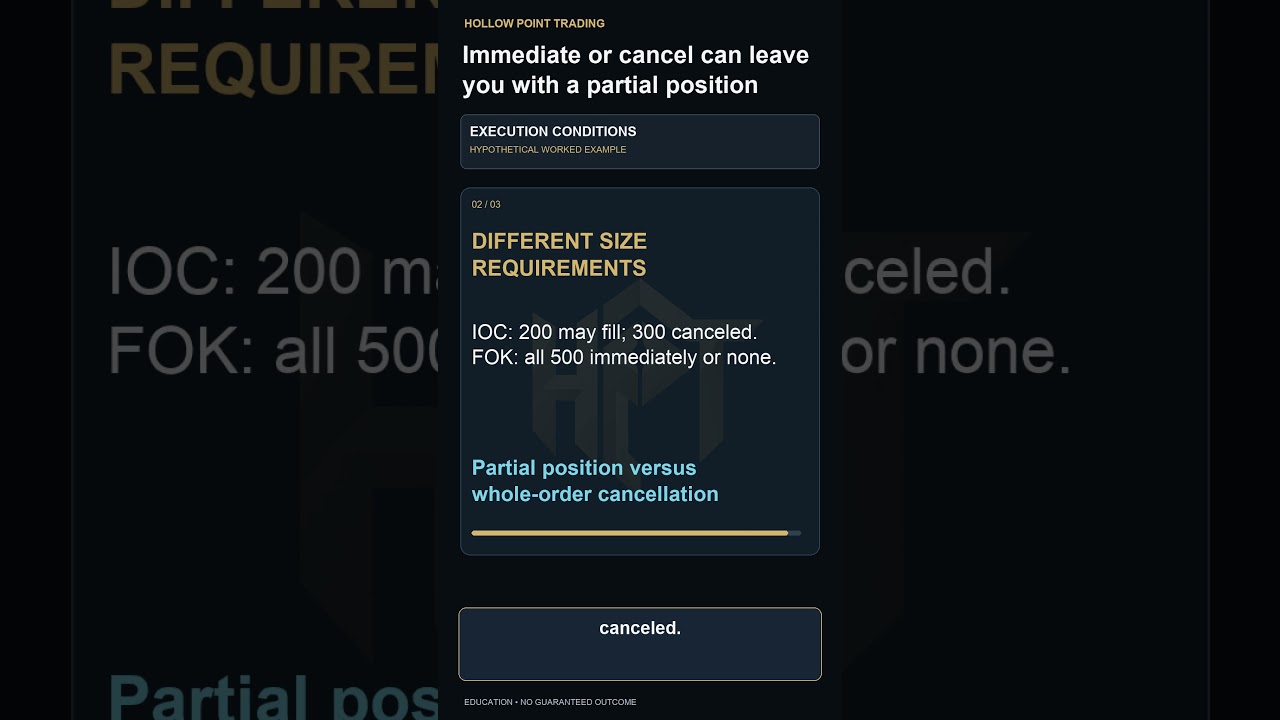
Immediate or cancel can leave you with a partial position #Shorts


Immediate or cancel does not mean all or nothing. Imagine a hypothetical buy limit for five hundred shares at twenty dollars. Assume only two hundred shares can execute immediately at that price or better, and the order type is supported. With immediate or cancel, those two hundred shares can fill and the remaining three hundred are canceled. Yo...

Immediate or Cancel Orders: Why Partial Fills Happen

COST Candlesticks: Engulfing Body vs. Full Range

https://youtu.be/pWTX5x9VG6w

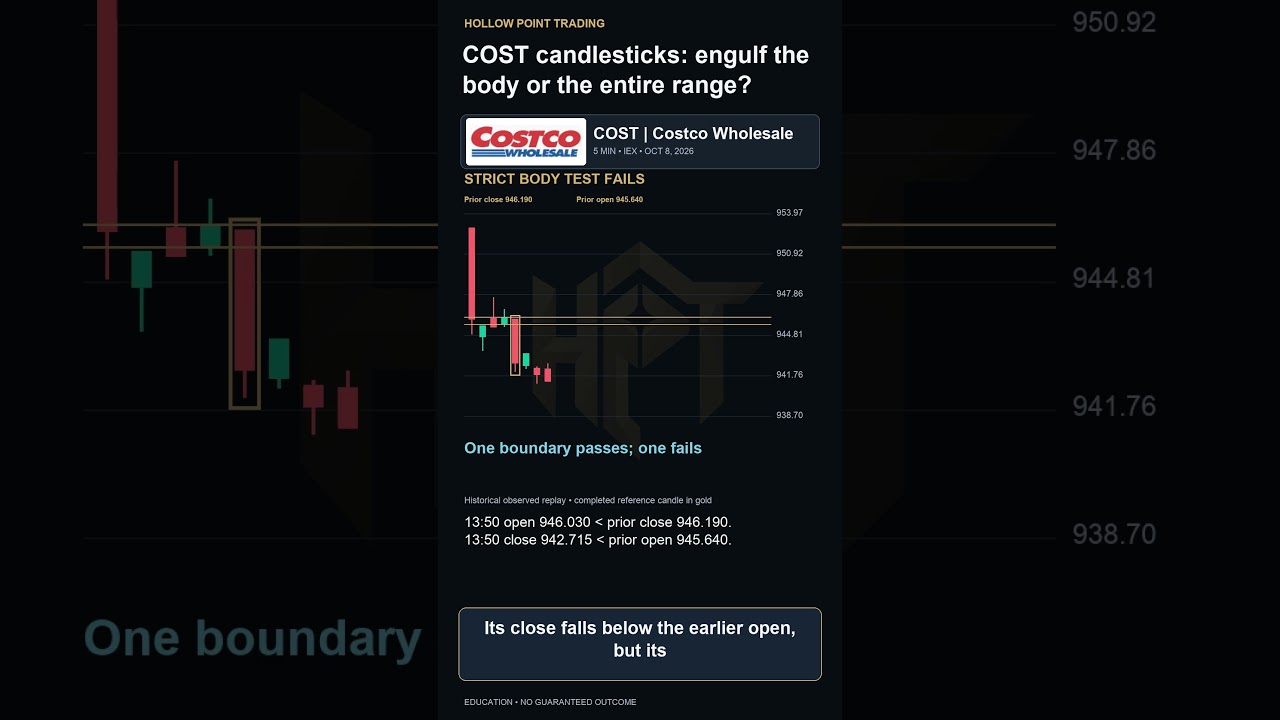
COST candlesticks: engulf the body or the entire range? #Shorts


An engulfing body and an outside candle are different tests. In this historical Costco IEX example from October eighth, twenty twenty six, the thirteen forty five candle opens at nine forty five point six four and closes at nine forty six point one nine. The next candle opens at nine forty six point oh three and closes at nine forty two point se...

COST Candlesticks: Engulfing Body vs. Full Range

Adjusted Profit: Bridge to Reported Earnings

https://youtu.be/ugF0w4txvk4

An adjusted profit needs its reconciliation bridge #Shorts


An adjusted profit headline needs a bridge back to reported earnings. Imagine a hypothetical company reports ten million dollars of net income under generally accepted accounting principles. Management adds back three million dollars of expenses, measured after tax. Adjusted net income becomes thirteen million dollars. The three million dollar d...

Adjusted Profit: Bridge to Reported Earnings

AMD Fibonacci Anchors Explained: Key Price Levels

https://youtu.be/h_PKVLq47Og

AMD Fibonacci: label when your anchors became known #Shorts


Fibonacci levels change when you change the anchors. This historical AMD IEX example marks the fourteen thirty five candle high at six forty point oh nine and the fifteen oh five candle low at six thirty four point four four. These are explicitly chosen anchors, not an automatic trading signal. The downward move spans five dollars sixty five cen...

AMD Fibonacci Anchors Explained: Key Price Levels

Revenue Growth Can Hide Falling Unit Sales

https://youtu.be/aOCw4obUO7c

Revenue growth can hide fewer units sold #Shorts


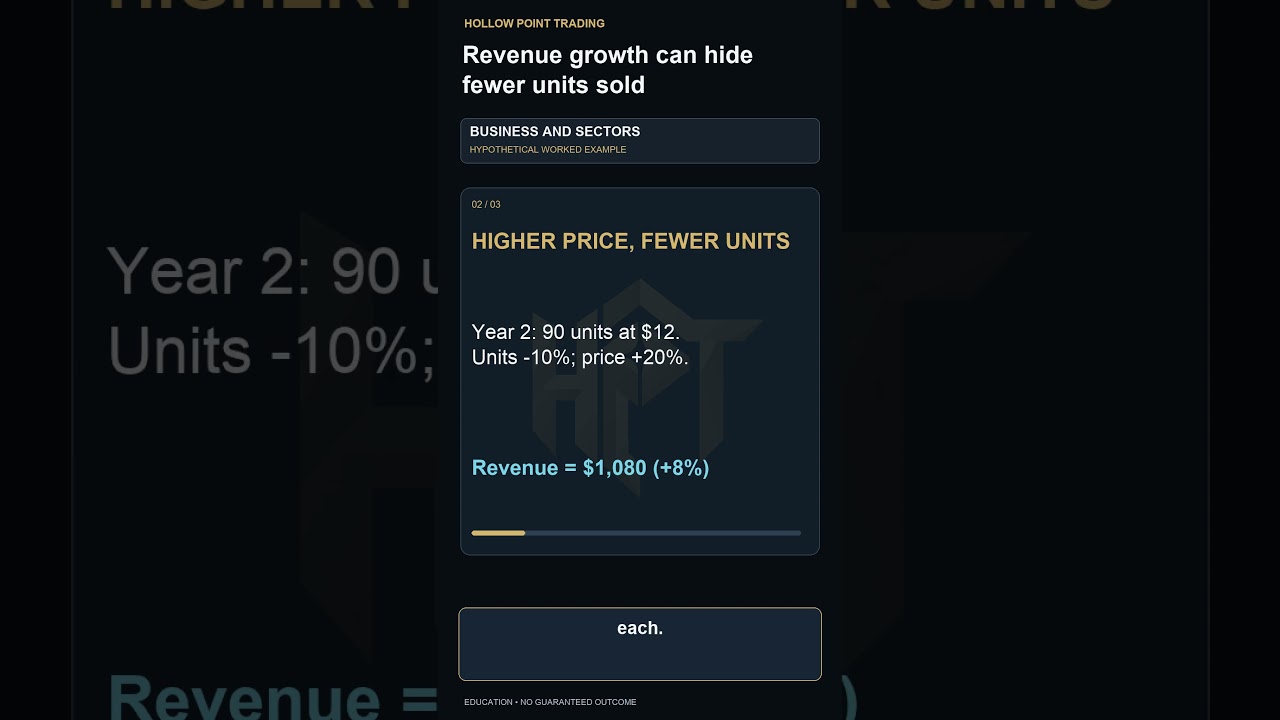
Revenue growth does not always mean more units sold. Imagine a seller offers one product. Last year it sold one hundred units at ten dollars each, for one thousand dollars of revenue. Ignore returns, discounts, and currency changes. This year it sells ninety units at twelve dollars each. Revenue is one thousand eighty dollars. Revenue rose eight...

Revenue Growth Can Hide Falling Unit Sales

JPM Fair Value Gap: Why the Midpoint Proves Nothing

https://youtu.be/9WA8YpCMkIU

JPM FVG: a midpoint is not proof of hidden orders #Shorts


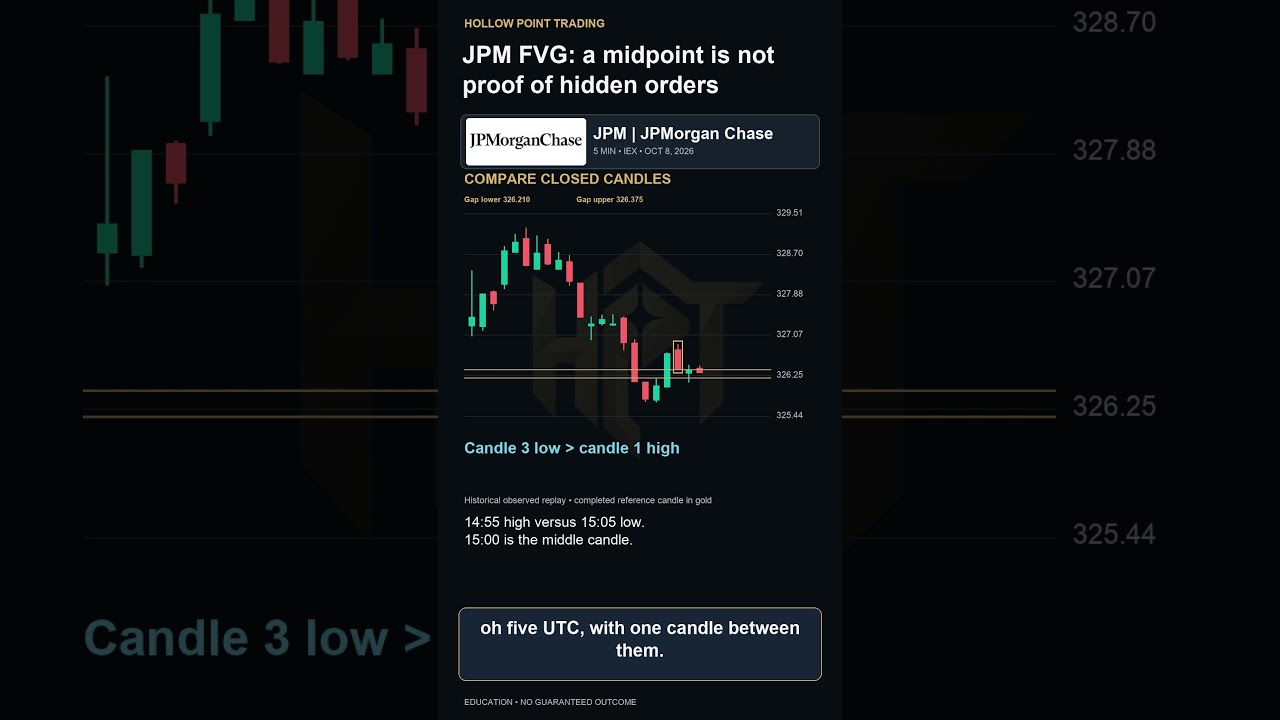
A fair value gap gives you measurable geometry, not proof of hidden bank orders. This historical JPMorgan IEX example uses five minute candles from October eighth, twenty twenty six. Compare the candles starting fourteen fifty five and fifteen oh five UTC, with one candle between them. The first candle high is three twenty six point two one. The...

JPM Fair Value Gap: Why the Midpoint Proves Nothing

Futures Margin vs. Exposure: Understand the Real Risk

https://youtu.be/v4lJ0OQ5yCA

A futures margin deposit is smaller than the exposure #Shorts


A futures margin deposit is not the full market exposure. Imagine a hypothetical index futures contract priced at five thousand points, with a multiplier of ten dollars per point. One contract has fifty thousand dollars of notional exposure. If the price falls fifty points, one long contract loses five hundred dollars before fees. The calculatio...

Futures Margin vs. Exposure: Understand the Real Risk

How Price Increases Raise Dollar Output

https://youtu.be/8FoFE4Kumgs

Higher dollar output can come from prices alone #Shorts


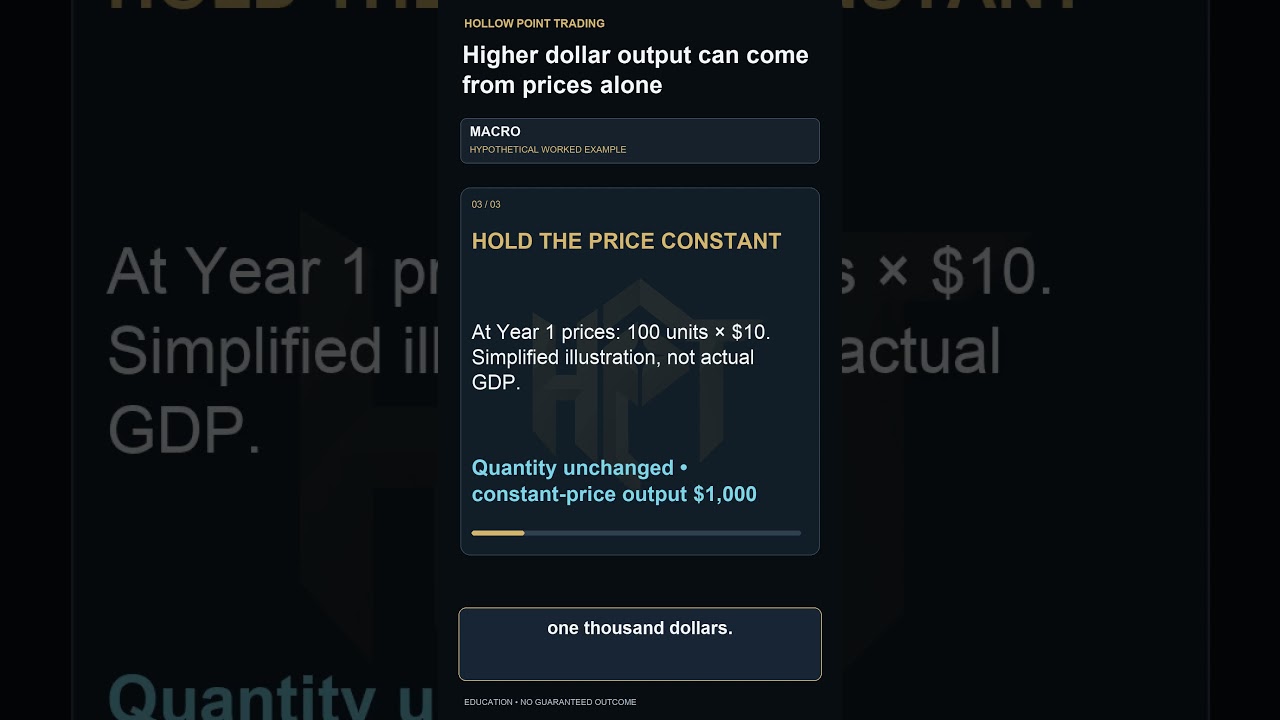
Higher dollar output does not always mean more production. In a hypothetical economy with one product, one hundred units sell for ten dollars each. Total output at current prices is one thousand dollars. Next year, the same one hundred units sell for eleven dollars each. Current price output rises to eleven hundred dollars, a ten percent increas...

How Price Increases Raise Dollar Output

Debt Timing Risk: Why Repayment Schedules Matter

https://youtu.be/mn51rkqXGkA

The same total debt can have different timing risk #Shorts


Total debt does not reveal when repayment is due. Imagine two hypothetical businesses each owe ten million dollars. One must repay one million within the next year. The other must repay eight million within the next year. The near term shares are ten percent and eighty percent. The debt totals match, but the repayment calendars differ. This exam...

Debt Timing Risk: Why Repayment Schedules Matter

How Returns and Allowances Reduce Net Revenue

https://youtu.be/CZlz-Wr6v4I

Returns and allowances change the sales headline #Shorts


A sales headline can hide customer returns. Imagine a hypothetical seller records one million dollars of gross sales, with one hundred thousand dollars of returns and allowances. Subtract those deductions and net revenue is nine hundred thousand dollars. Now assume the cost of goods sold is five hundred forty thousand dollars. Subtract that cost...

How Returns and Allowances Reduce Net Revenue

Interest Coverage vs. Principal Repayment Explained

https://youtu.be/3HDvB9RiDNM

Interest coverage is not principal repayment coverage #Shorts


Interest coverage does not count every debt payment. In a hypothetical example, operating profit before interest and taxes is twelve million dollars. Interest expense is three million dollars. Dividing twelve by three gives four times interest coverage. Now suppose six million dollars of loan principal also comes due. Four times coverage does no...

Interest Coverage vs. Principal Repayment Explained

Working Capital Dollars: What the Current Ratio Misses

https://youtu.be/5s8Gdo8eFf4

Working capital dollars answer a different question #Shorts


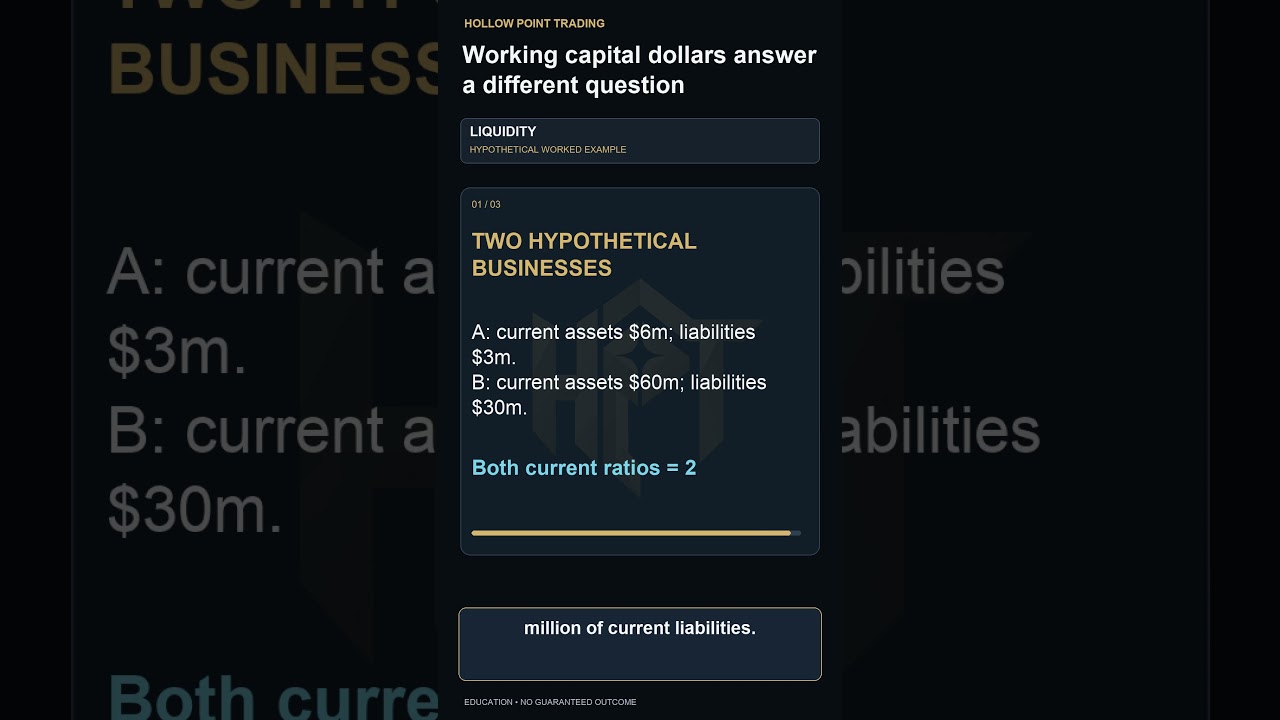
A current ratio does not tell you the dollar cushion. Imagine one hypothetical business has six million dollars of current assets and three million of current liabilities. Another has sixty million of current assets and thirty million of current liabilities. Both current ratios equal two. But subtract current liabilities from current assets. Wor...

Working Capital Dollars: What the Current Ratio Misses

Selling an Asset: Cash Proceeds vs. Profit

https://youtu.be/mhul7fnmJqE

Selling an asset does not make every dollar profit #Shorts


A cash inflow is not always revenue or profit. Imagine a hypothetical business sells equipment for eight thousand dollars. The equipment has a carrying value of six thousand dollars at the sale date. Ignoring transaction costs and taxes, the accounting gain is two thousand dollars. Cash proceeds are eight thousand. The six thousand dollar carryi...

Selling an Asset: Cash Proceeds vs. Profit

Effective Tax Rate: Use Profit, Not Revenue

https://youtu.be/JUoVzH3P1yk

An effective tax rate needs the right profit denominator #Shorts


Revenue is the wrong denominator for this income tax ratio. In our hypothetical example, revenue is one hundred million dollars. Profit before tax is ten million dollars, and income tax expense is two million dollars. Tax expense divided by profit before tax gives twenty percent. Dividing that same tax expense by revenue gives two percent. Those...

Effective Tax Rate: Use Profit, Not Revenue

Cash Runway Explained: Why Burn Rate Changes Everything

https://youtu.be/TE0hESfO29c

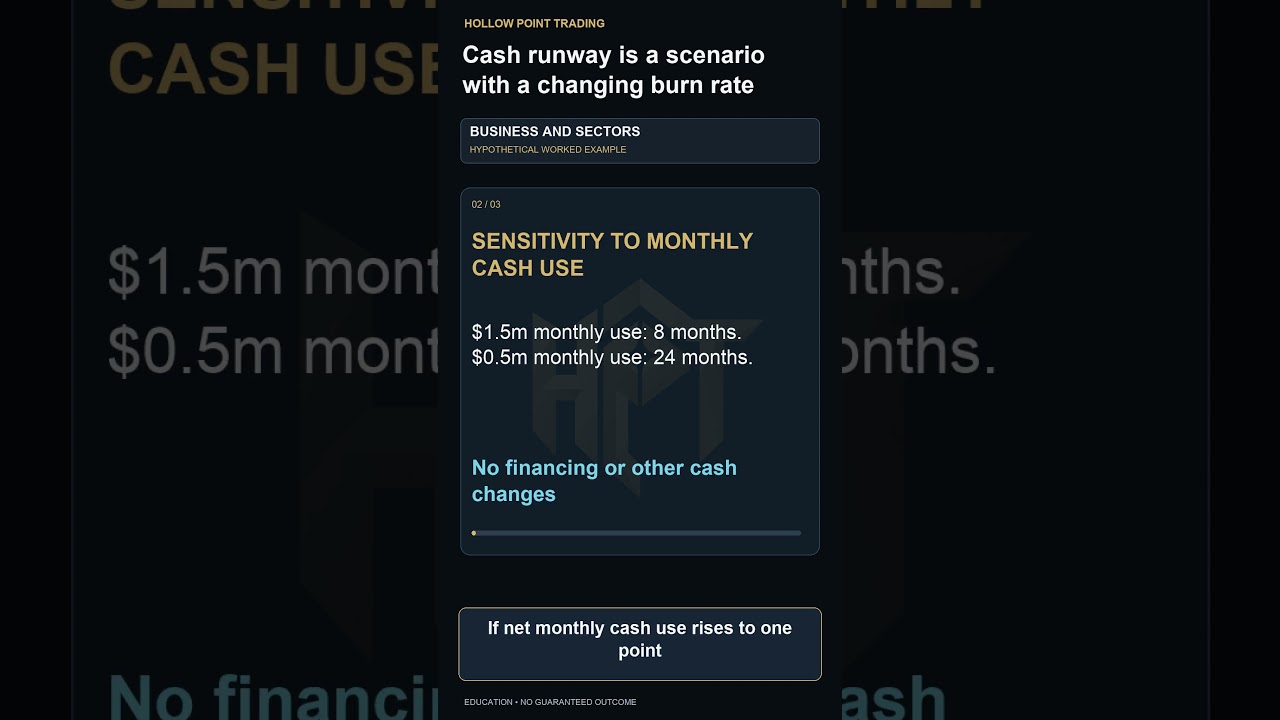
Cash runway is a scenario with a changing burn rate #Shorts


Cash runway is a scenario, not an expiration date. Imagine a hypothetical business has twelve million dollars of available cash and uses one million dollars of net cash per month. Holding that rate constant gives twelve months of runway. If net monthly cash use rises to one point five million dollars, the same cash lasts eight months. If it fall...

Cash Runway Explained: Why Burn Rate Changes Everything