Hollow Point Trading
Hollow Point Trading Discord server banner

Hollow Point Trading Updates & Events

Server Updates & Events

Announcements

UPS PPO: Normalize Moving Average Differences

https://youtu.be/gZn7Jhizqmc

UPS: PPO normalizes the moving average difference #UPS #PPO #Techni...


The same moving average difference can be stated in dollars or percent. This historical UPS IEX replay uses completed five minute closes from October eighth, twenty twenty six. We choose twelve and twenty six period exponential averages, each seeded with the first observed close. We calculate only the main oscillator, not its signal or histogram...

UPS PPO: Normalize Moving Average Differences

Treasury Bill Discount Rate vs. Your Actual Return

https://youtu.be/Si-gXOLUubo

A Treasury bill discount quote is not your holding return #Treasury...


A Treasury bill discount rate is not the percentage earned on your purchase cash. Consider a hypothetical bill with ten thousand dollars of face value, purchased for nine thousand eight hundred, with one hundred eighty days until maturity. Assume it is held to maturity, with fees and taxes excluded. The two hundred dollar discount divided by ten...

Treasury Bill Discount Rate vs. Your Actual Return

MCD R-Squared: Historical Fit, Not Trade Odds

https://youtu.be/eWPzhwnnguc

MCD: R squared measures historical fit, not next trade odds #MCD #R...


R squared is not the probability that the next trade wins. This historical McDonald's IEX example fits twenty completed five minute closes from October eighth, twenty twenty six. We use ordinary least squares with an intercept and interval numbers from zero through nineteen. Total squared variation measures each close against the sample mean. Re...

MCD R-Squared: Historical Fit, Not Trade Odds

Inflation Breakevens Don’t Guarantee Future Inflation

https://youtu.be/PaJsjO-37OY

An inflation breakeven is not a guaranteed future inflation rate #B...


Market breakevens do not guarantee future inflation. In a hypothetical matched maturity comparison, a nominal Treasury yields five percent and an inflation protected Treasury has a real yield of two percent. The simple quoted yield difference is three percentage points. That spread is commonly called breakeven inflation, or inflation compensatio...

Inflation Breakevens Don’t Guarantee Future Inflation

NEE Channel Midpoint: Why It Isn’t an Average

https://youtu.be/Hf8x2odoDZc

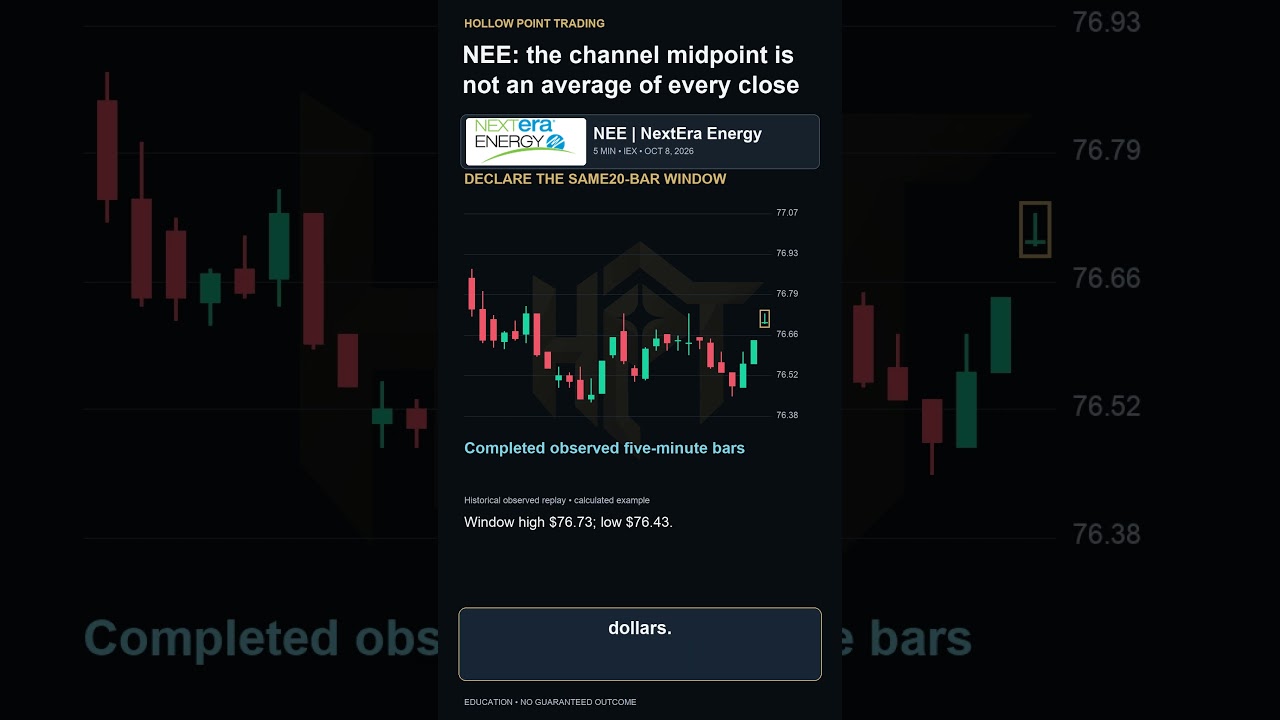
NEE: the channel midpoint is not an average of every close #NEE #Do...


A channel midpoint is not necessarily the average closing price. This historical NextEra Energy IEX replay uses twenty completed five minute bars from October eighth, twenty twenty six. The declared window high is seventy six point seven three dollars. The window low measures seventy six point four three dollars. Add those two extremes and divid...

NEE Channel Midpoint: Why It Isn’t an Average

CAT Volatility: Why a Reading Above 100 Isn’t a Return

https://youtu.be/EC68Cq_sz5Q

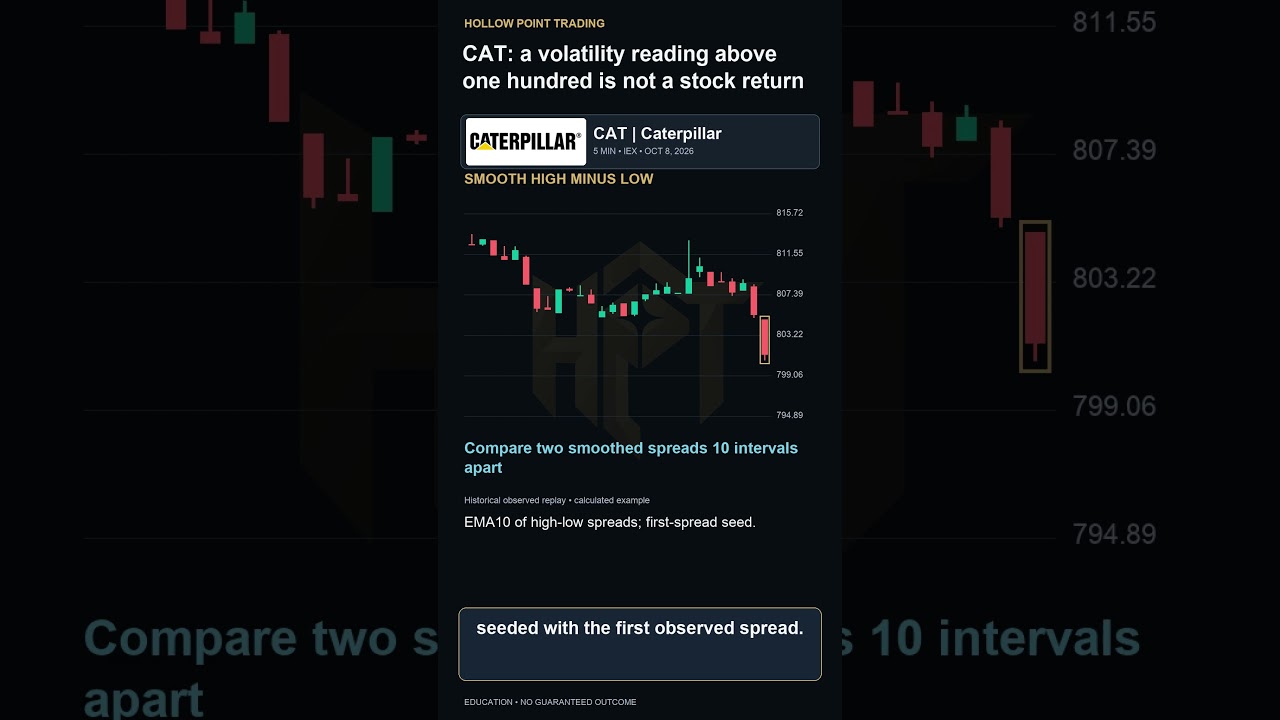
CAT: a volatility reading above one hundred is not a stock return #...


A volatility reading above one hundred does not mean the stock doubled. This historical Caterpillar IEX replay uses completed five minute bars from October eighth, twenty twenty six. For this Chaikin volatility example, calculate each high minus low spread. Smooth those spreads with a ten period exponential average, seeded with the first observe...

CAT Volatility: Why a Reading Above 100 Isn’t a Return

Sharpe Ratio Explained: Returns, Risk, and Time Units

https://youtu.be/5c--PuWCDw0

Sharpe uses excess return and matched time units #SharpeRatio #Risk...


A Sharpe ratio is not your chance of winning the next trade. In a hypothetical monthly sample, assume average portfolio return is one percent per month. A matched monthly risk free return is zero point two percent, and the standard deviation of monthly excess returns is two percent. Subtract the monthly risk free return from the monthly average....

Sharpe Ratio Explained: Returns, Risk, and Time Units

QCOM Double EMA: Why It Doesn’t Double the Period

https://youtu.be/N1NrsSbUjOQ

QCOM: double exponential does not mean double the period #QCOM #DEM...


Double exponential moving average does not mean doubling the lookback period. This historical Qualcomm IEX replay uses completed five minute observations from October eighth, twenty twenty six. We choose length ten. For this worked calculation, seed both exponential filters with the first observed close, using a smoothing weight of two divided b...

QCOM Double EMA: Why It Doesn’t Double the Period

BAC Ultimate Oscillator: Why Windows Aren’t Confirmations

https://youtu.be/rsw6C-8SkG0

BAC: three oscillator windows are not three independent signals #BA...


Three lookback windows are not three independent confirmations. This historical Bank of America IEX replay uses completed five minute intervals from October eighth, twenty twenty six. Ultimate Oscillator defines buying pressure as close minus the smaller of current low and previous close. Its matching true range spans the larger high or previous...

BAC Ultimate Oscillator: Why Windows Aren’t Confirmations

UNH Vortex: What the Plus Line Really Measures

https://youtu.be/LztodYawyWI

UNH: Vortex compares cross-bar distances, not buyer counts #UNH #Vo...


The plus line in Vortex is not a count of buyers. This historical UnitedHealth IEX data uses fourteen completed five minute intervals from October eighth, twenty twenty six. For each interval, positive movement means the absolute distance from the previous low to the current high. Negative movement uses the current low and previous high. Sum tho...

UNH Vortex: What the Plus Line Really Measures

Profit Factor Explained: Measure Trading Gains vs. Losses

https://youtu.be/_h4QGqSVhCk

Profit factor compares dollar totals, not your win percentage #Prof...


Profit factor is not your win rate or your account return. Consider four hypothetical closed trades, with costs already included. The gains are three hundred dollars and one hundred dollars. The losses are fifty dollars and one hundred fifty dollars. Total winning dollars are four hundred. Total losing dollars have a magnitude of two hundred. Pr...

Profit Factor Explained: Measure Trading Gains vs. Losses

Currency Forward Premium Is No Guaranteed Forecast

https://youtu.be/TO8n_yThZCo

A currency forward premium is not a guaranteed forecast #CurrencyFo...


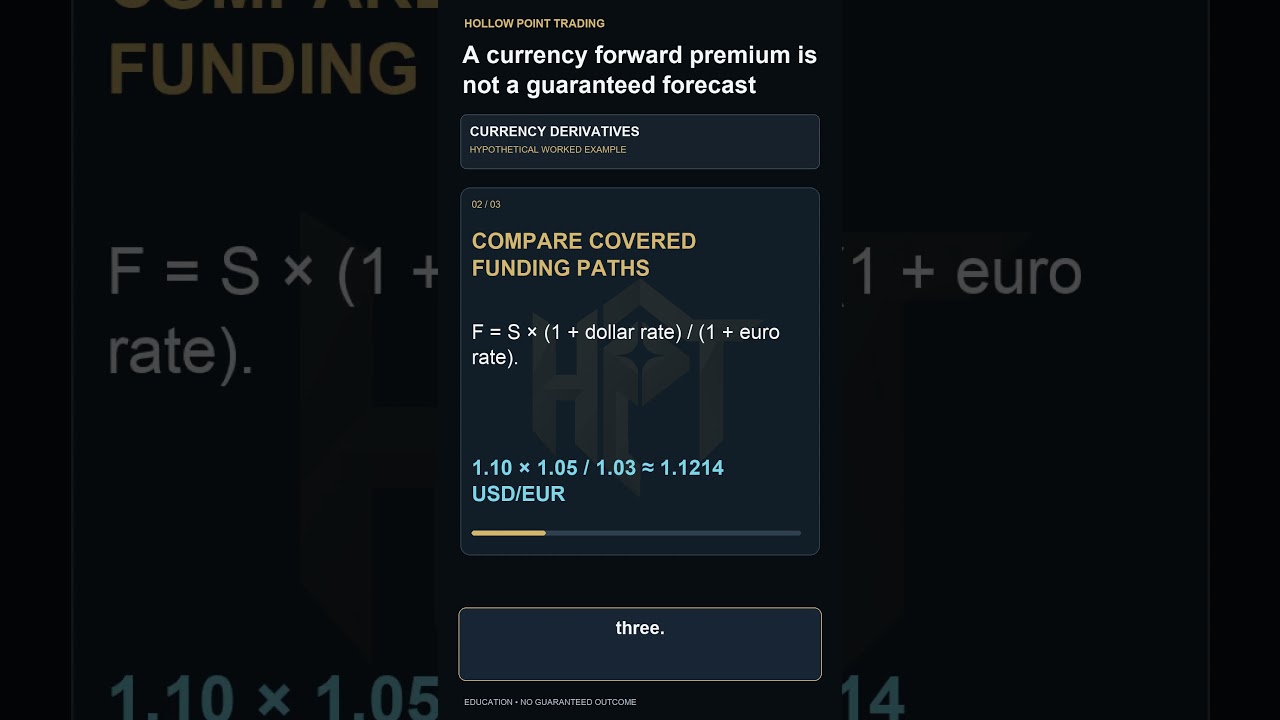
A forward currency quote is not a guaranteed prediction of the future spot price. In a hypothetical frictionless example, one euro costs one dollar ten today. Assume matched one year simple rates of five percent for dollars and three percent for euros. For dollars per euro, multiply the spot rate by one point zero five divided by one point zero ...

Currency Forward Premium Is No Guaranteed Forecast

XOM Choppiness Indicator: Reading Range vs. True Range

https://youtu.be/gqDdoHHpoZ4

XOM: choppiness compares accumulated range with the envelope #XOM #...


Choppiness does not tell you whether the next move is up or down. This historical ExxonMobil IEX replay uses fourteen completed five minute intervals from October eighth, twenty twenty six. We sum each interval true range, including its previous close, then compare that sum with the window high minus its low. The summed true ranges are approxima...

XOM Choppiness Indicator: Reading Range vs. True Range

Price Volume Trend: How Fractional Moves Weight Volume

https://youtu.be/jjpo8vVmJw0

JPM: PVT weights volume by a fractional price change #JPM #PriceVol...


Price Volume Trend does not add the entire volume on every rising close. This historical JPMorgan IEX replay uses completed five minute observations from October eighth, twenty twenty six. The previous close is three hundred twenty eight point two three dollars. The next close is three hundred twenty eight point eight four. The close change is s...

Price Volume Trend: How Fractional Moves Weight Volume

Ex-Dividend Date: Who Qualifies for a Dividend?

https://youtu.be/jjOZJTSj8rI

The ex dividend date controls who gets this payment #Dividends #ExD...


The day a dividend is paid is not the deadline for buying the stock to receive it. For a regular cash dividend under the ordinary rule, a purchase on or after the ex dividend date does not receive that declared payment. A purchase before that date generally does. Imagine a declared dividend of fifty cents per share. An eligible holder of one hun...

Ex-Dividend Date: Who Qualifies for a Dividend?

META Chart Replay: Indexed Values vs. Dollars

https://youtu.be/v_OKlWfe81k

META: indexed to one hundred does not mean one hundred dollars #MET...


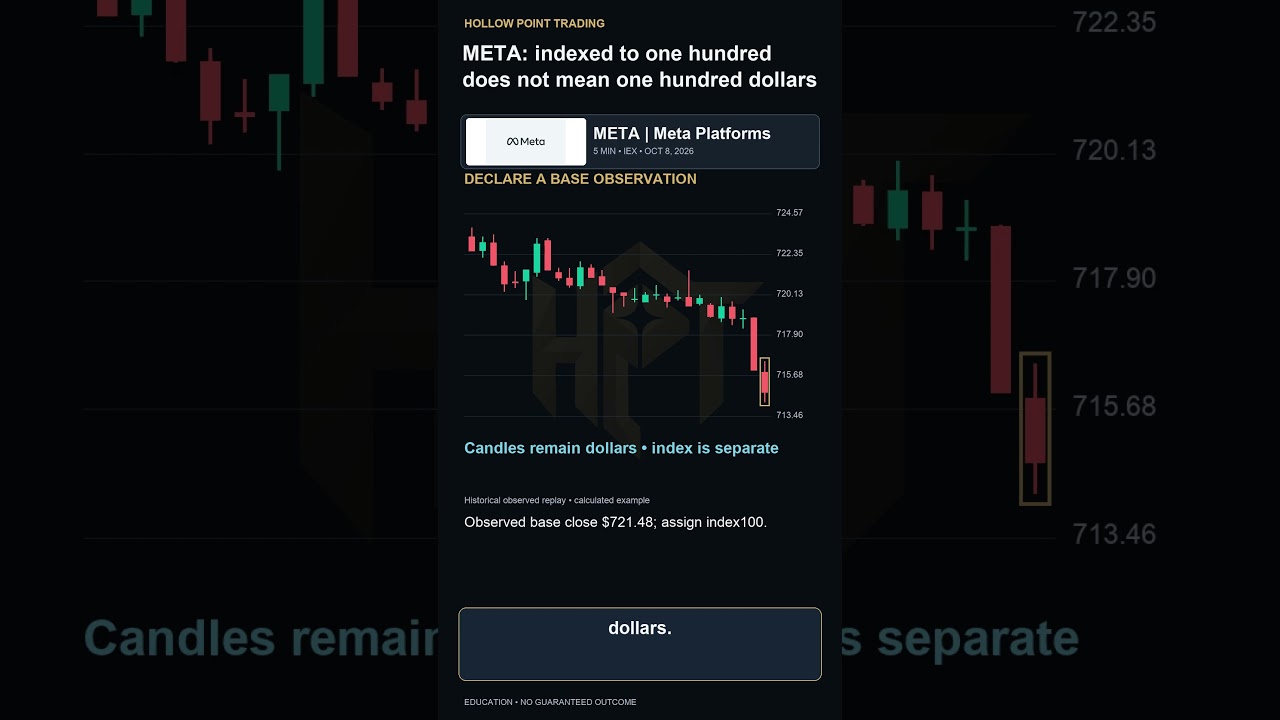
An indexed chart value is not a dollar quote. This historical Meta IEX replay uses completed five minute observations from October eighth, twenty twenty six. The candles remain in dollars. For a separate calculation, set the twentieth interval close as our declared base of one hundred. That base close is 721.48 dollars. At the marked later close...

META Chart Replay: Indexed Values vs. Dollars

Dollar-Cost Averaging: Why Prices Aren’t Averaged

https://youtu.be/dGfhOztRStM

Equal cash purchases do not average the quoted prices #DollarCostAv...


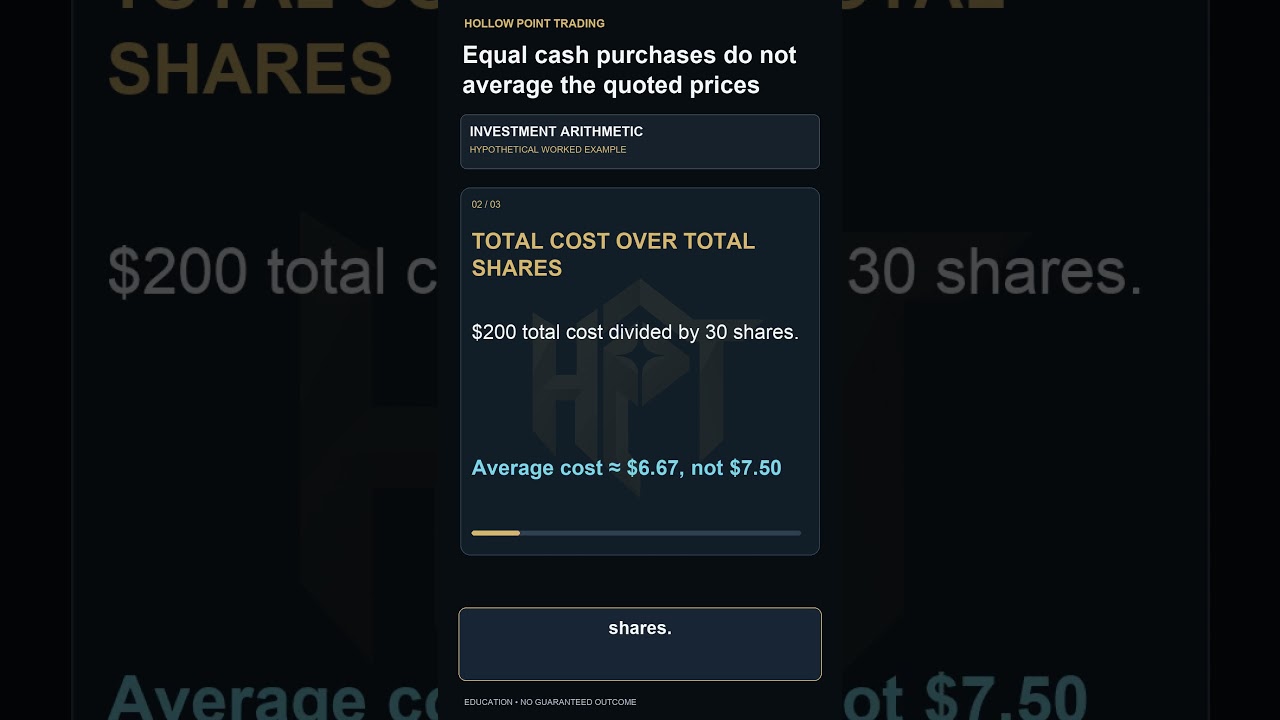
Equal dollar purchases do not give you the simple average of two quoted prices. In this hypothetical example, invest one hundred dollars when a share costs ten dollars. That buys ten shares. Later invest another hundred dollars at five dollars per share, buying twenty more. You have spent two hundred dollars and bought thirty shares. Divide tota...

Dollar-Cost Averaging: Why Prices Aren’t Averaged

AMD Opening Jump vs. Overlapping Ranges Explained

https://youtu.be/dyVmCIu7S9I

AMD: an opening jump can coexist with overlapping ranges #AMD #Pric...


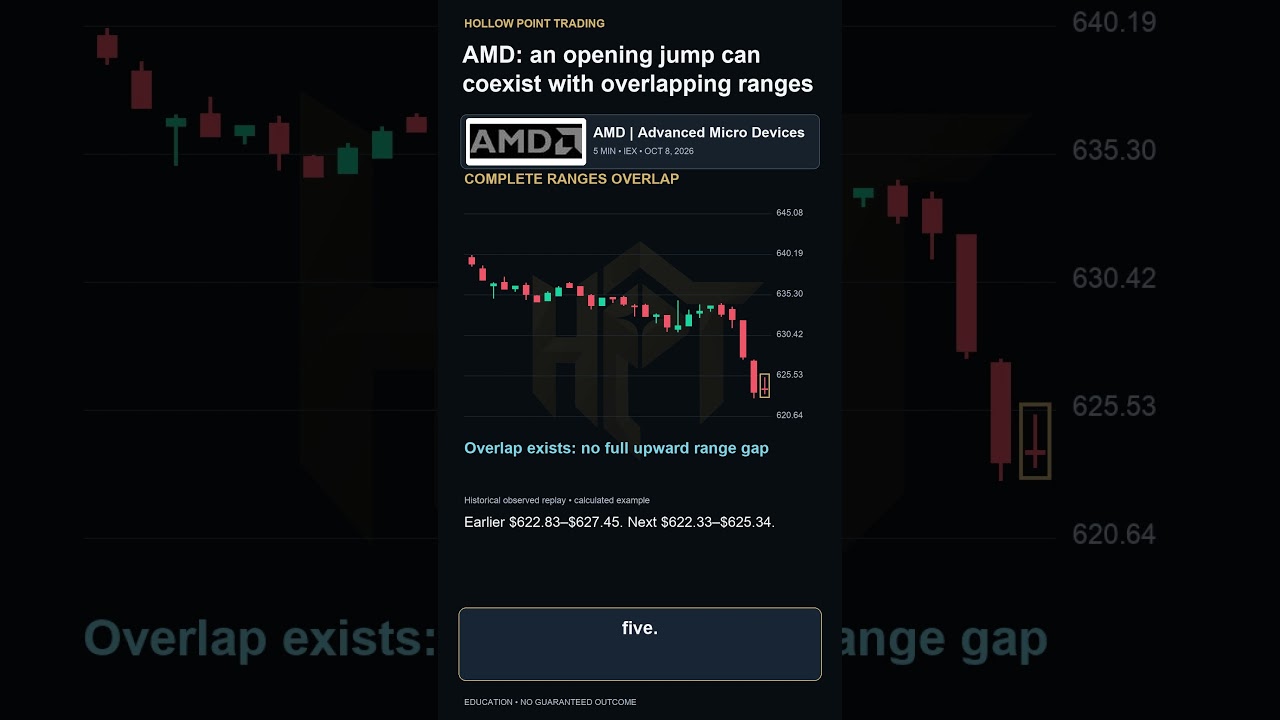
An opening jump is different from a gap between complete candle ranges. This historical AMD IEX replay uses completed five minute observations from October eighth, twenty twenty six. The earlier close is six twenty three point five two dollars. The next observed open is six twenty three point nine five. That opening difference is positive forty ...

AMD Opening Jump vs. Overlapping Ranges Explained

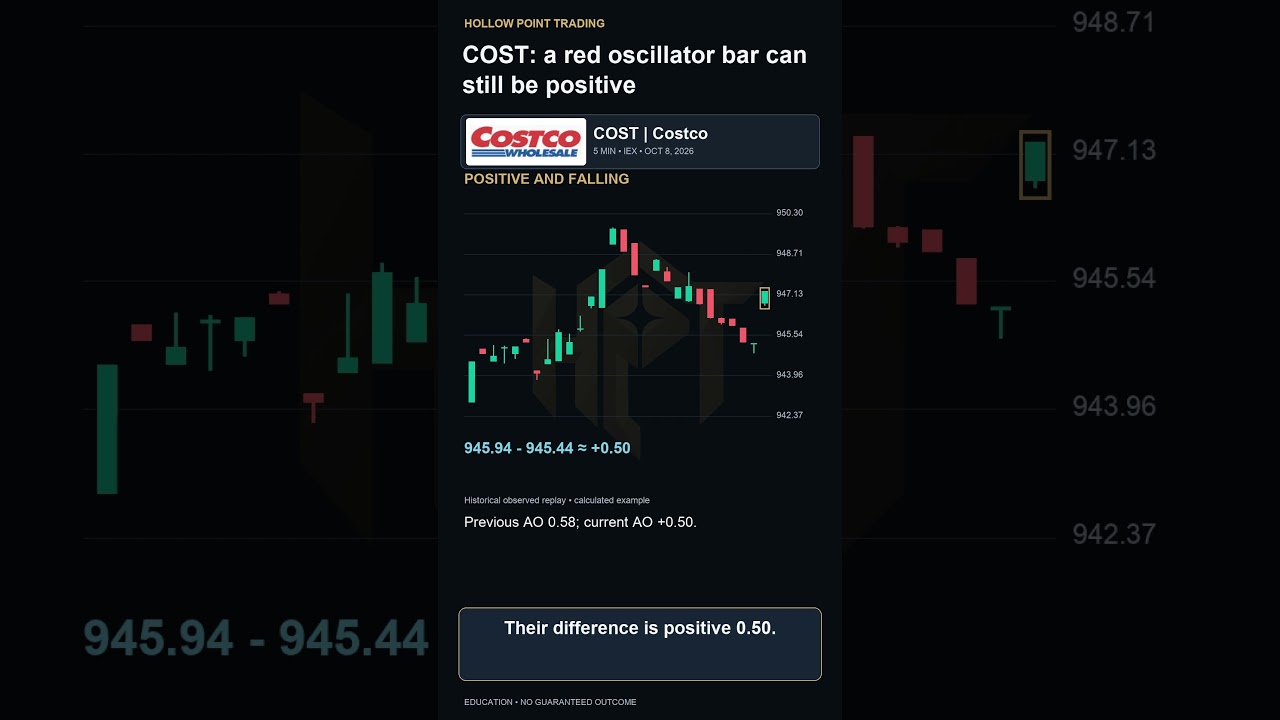
COST: Why a Red Awesome Oscillator Bar Can Be Positive

https://youtu.be/P5AtqG6gi8A

COST: a red oscillator bar can still be positive #COST #AwesomeOsci...


A red oscillator bar does not necessarily mean the oscillator is below zero. This historical Costco IEX replay uses completed five minute bars from October eighth, twenty twenty six. We calculate Awesome Oscillator from bar midpoints, using the five period simple average minus the thirty four period average. At the marked interval, those average...

COST: Why a Red Awesome Oscillator Bar Can Be Positive

JNJ Trading: Why a Channel Ceiling Can Fall

https://youtu.be/dEqvIEJH1yk

JNJ: a channel can fall because an old high expires #JNJ #DonchianC...


A falling channel ceiling can reflect an old observation expiring. This historical Johnson and Johnson IEX replay uses completed five minute bars from October eighth, twenty twenty six. Define the ceiling as the highest high in ten observed bars, including the latest completed bar. The old window has a highest high of two fifty three point three...

JNJ Trading: Why a Channel Ceiling Can Fall

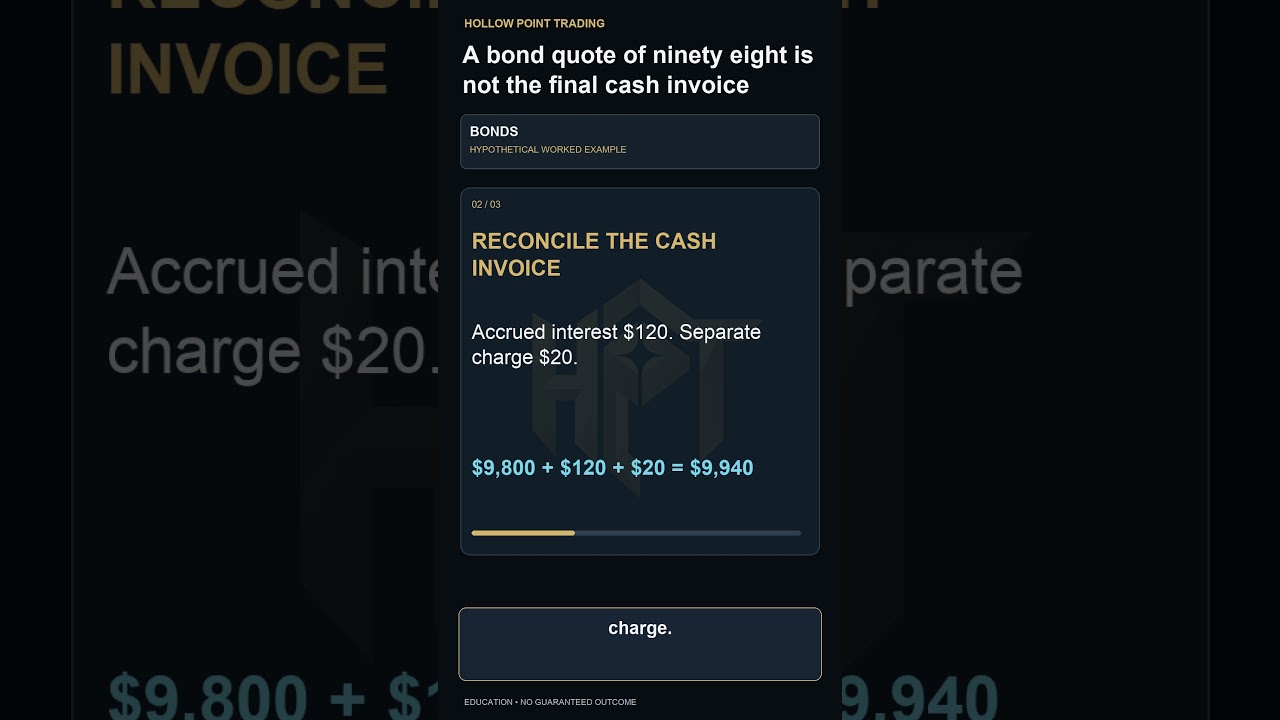
Bond Quotes vs. Final Cash Invoice Explained

https://youtu.be/ucWq83uh0dg

A bond quote of ninety eight is not the final cash invoice #Bonds #...


A bond quote is not automatically the final cash invoice. Consider a hypothetical coupon bond quoted at ninety eight per hundred of face value. You buy ten thousand dollars of face value. The quoted principal amount is nine thousand eight hundred dollars, not ninety eight dollars. Suppose the trade confirmation separately states one hundred twen...

Bond Quotes vs. Final Cash Invoice Explained

AVGO Regression Slope: Why Time Units Matter

https://youtu.be/fbxLV3QvpzI

AVGO: a regression slope needs a time unit #AVGO #LinearRegression ...


A regression slope needs units before it can be compared. This historical Broadcom IEX replay uses twenty completed five minute closes from October eighth, twenty twenty six. Fit a straight line using bar numbers zero through nineteen. Its slope measures dollars per bar, not a percentage return. The fitted slope is approximately -0.0877 dollars ...

AVGO Regression Slope: Why Time Units Matter

WMT: Volume-Weighted vs. Anchored Averages

https://youtu.be/wozbI1Jl7oc

WMT: volume weighting does not make two windows identical #WMT #VWM...


Volume weighting does not make a rolling average identical to an anchored average. This historical Walmart IEX replay uses completed five minute bars from October eighth, twenty twenty six. Both use bar closes and the same reported volume. The ten bar volume weighted average uses the latest ten completed bars. At our marked reference it is appro...

WMT: Volume-Weighted vs. Anchored Averages

Earnings Yield Explained: Why 5% Isn’t a Cash Payout

https://youtu.be/l0TZyrydv8c

A five percent earnings yield is not a cash payment #EarningsYield ...


A five percent earnings yield does not promise a five percent cash payment. Consider a hypothetical company priced at one hundred dollars per share, with five dollars of diluted earnings per share over the trailing twelve months. Its price to earnings ratio is twenty. Earnings divided by price gives five percent. Suppose the company distributes ...

Earnings Yield Explained: Why 5% Isn’t a Cash Payout

XOM Drawdown Analysis: Why a Bounce Isn’t Recovery

https://youtu.be/7p62Cz5PP34

XOM: a bounce is not a recovered drawdown #XOM #Drawdown #RiskManag...


A bounce after a decline does not mean the drawdown has recovered. This historical ExxonMobil IEX replay uses forty one completed five minute closing observations from October eighth, twenty twenty six. We measure drawdown from each running closing peak, not from intrabar highs. The largest closing peak to subsequent closing trough decline in th...

XOM Drawdown Analysis: Why a Bounce Isn’t Recovery