Hollow Point Trading
Hollow Point Trading Discord server banner

Hollow Point Trading Updates & Events

Server Updates & Events

Announcements

How Simpson’s Paradox Reverses Success Rates

https://youtu.be/4-idqfpe83I

A higher total success rate can reverse inside every subgroup #Simp...


A higher total success rate can hide lower rates in every subgroup. In a hypothetical comparison, approach A succeeds in eighty of one hundred easier cases. Approach B succeeds in nine of ten: eighty percent versus ninety percent. For harder cases, A succeeds in one of ten, while B succeeds in twenty of one hundred: ten percent versus twenty per...

How Simpson’s Paradox Reverses Success Rates

Markup vs. Gross Margin: Know the Difference

https://youtu.be/hLHCnD11UKw

A fifty percent markup is not a fifty percent gross margin #GrossMa...


A fifty percent markup does not mean a fifty percent gross margin. Imagine a hypothetical product costs eighty dollars and sells for one hundred twenty dollars. Gross profit is forty dollars before overhead, interest and taxes. Markup divides that forty dollar gross profit by the eighty dollar cost. It is fifty percent. Gross margin divides the ...

Markup vs. Gross Margin: Know the Difference

How to Add Log Returns Across Time

https://youtu.be/xhokIuL21RY

JNJ log returns: adding across time needs the right return definiti...


Adding returns across time requires the right definition. This historical Johnson and Johnson IEX example uses three completed five minute closes from October eighth, twenty twenty six: two fifty two point eight eight five, two fifty three point seven five, and two fifty four point seven two. Take the natural logarithm of each next close divided...

How to Add Log Returns Across Time

JPM Regression: Fitted Price vs. Actual Close

https://youtu.be/v_zn-U2Pba8

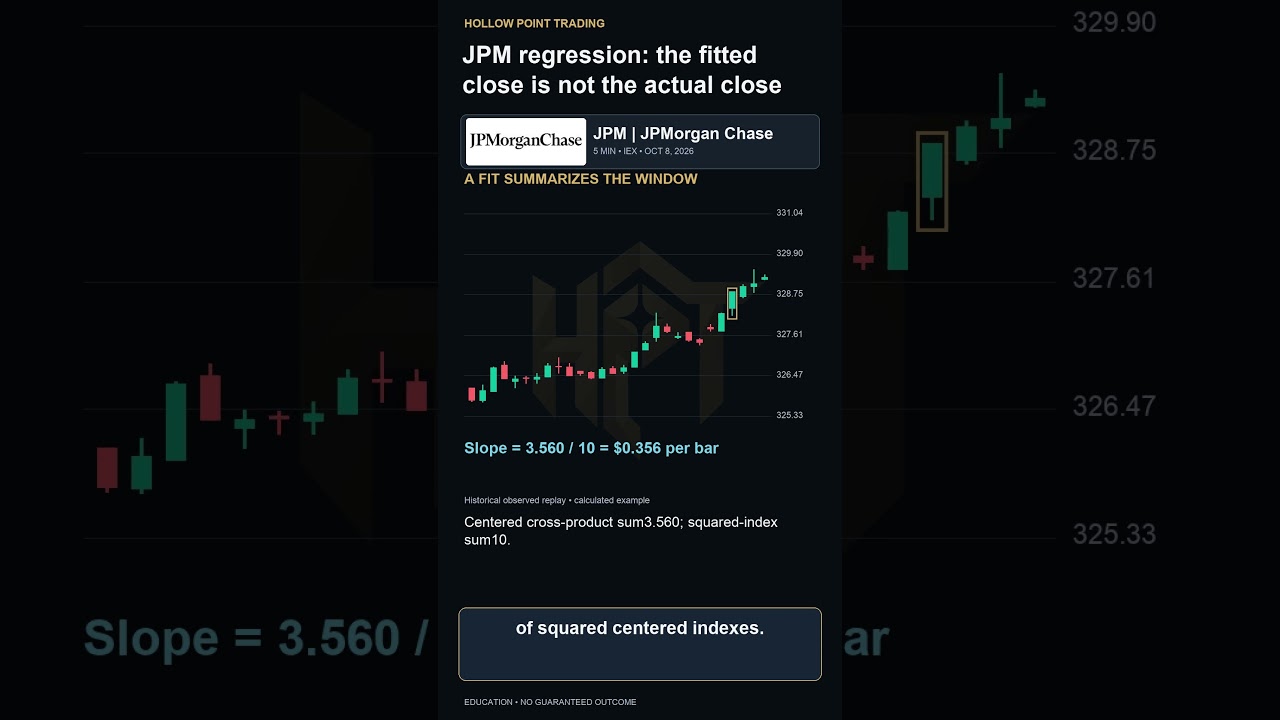
JPM regression: the fitted close is not the actual close #JPM #Line...


A fitted trend value is not an observed trade. This historical JPMorgan IEX example uses five completed five minute closes from October eighth, twenty twenty six. Number the bars zero through four, oldest to newest. Their average index is two; average close is three twenty seven point nine four eight. For a least squares straight line, divide th...

JPM Regression: Fitted Price vs. Actual Close

GOOGL Weighted Average: How Recent Closes Matter

https://youtu.be/BrysFz_6qaI

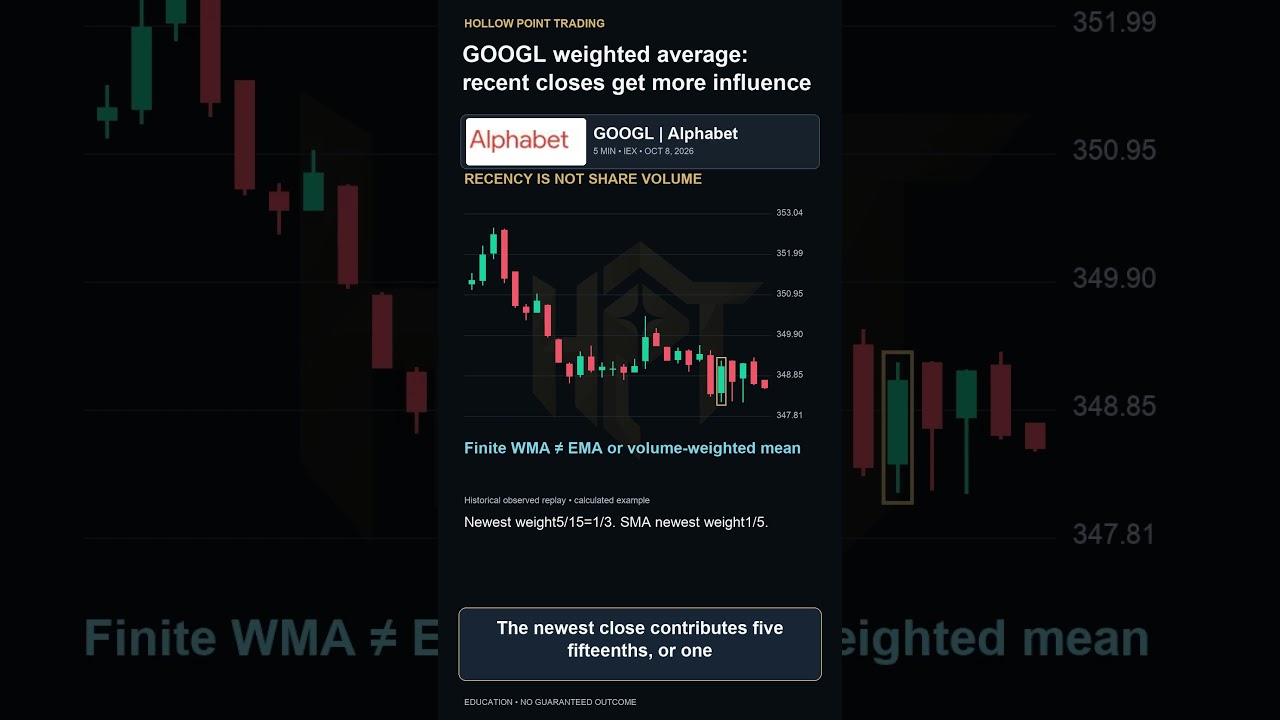
GOOGL weighted average: recent closes get more influence #Shorts


A weighted moving average needs its weights declared. This historical Alphabet IEX example uses five completed five minute closes from October eighth, twenty twenty six. We assign weights one, two, three, four and five from oldest to newest. Their sum is fifteen. Multiply each close by its weight, add the products, and divide by fifteen. The fiv...

GOOGL Weighted Average: How Recent Closes Matter

COST Directional Movement: How Outside Bars Score

https://youtu.be/sdGBAMPZOCo

COST directional movement: an outside bar does not score both sides...


An outside candle can expand both ways without scoring positive directional movement on both sides. This historical Costco IEX example compares two completed five minute bars from October eighth, twenty twenty six. The previous high is nine forty seven point four one; the new high is nine forty seven point nine nine five. That upward extension i...

COST Directional Movement: How Outside Bars Score

ETF Selling vs. Creation Unit Redemption Explained

https://youtu.be/IKWv54KTmuw

Selling ETF shares is different from redeeming a creation unit #Shorts


Selling an ETF share on an exchange is different from redeeming shares directly with the fund. Retail investors generally trade individual shares in the secondary market. Authorized participants can create or redeem large blocks under agreements with the fund. Imagine a hypothetical creation unit of fifty thousand shares and net asset value of t...

ETF Selling vs. Creation Unit Redemption Explained

BAC RSI Explained: Gains, Losses, and Wilder Smoothing

https://youtu.be/Mcle-5aOv9w

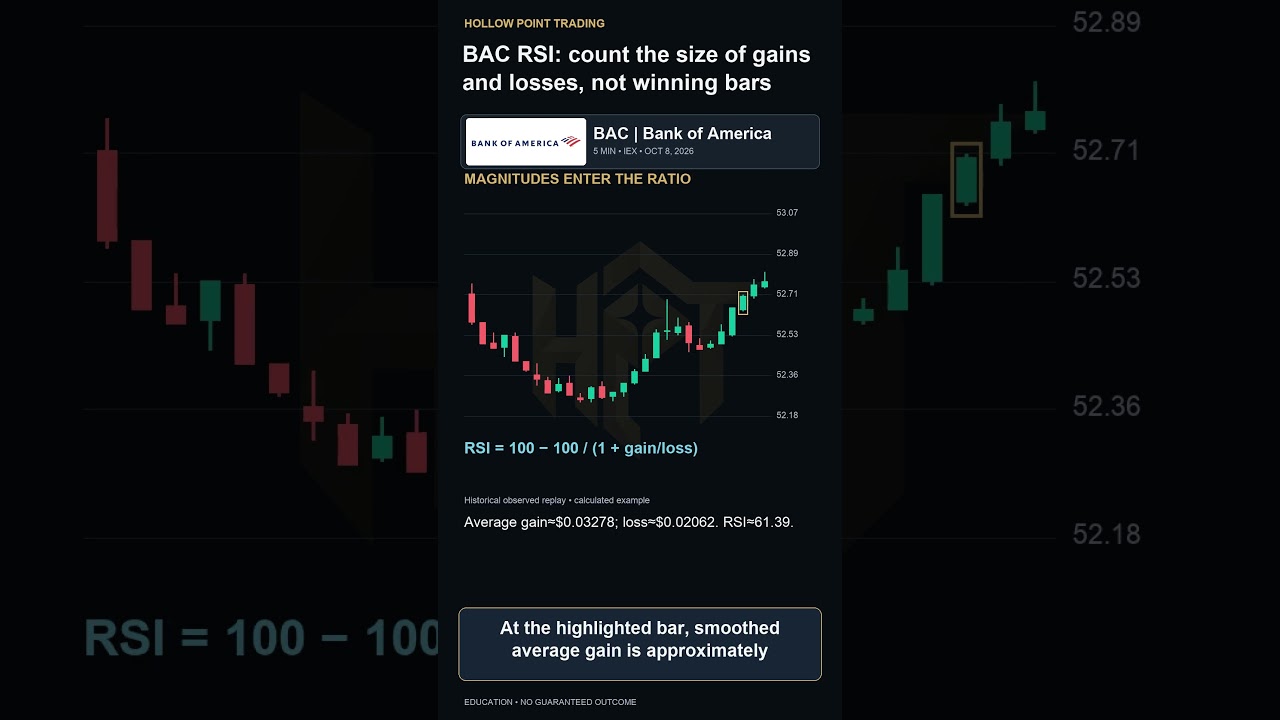
BAC RSI: count the size of gains and losses, not winning bars #Shorts


RSI does not count the percentage of winning candles. This historical Bank of America IEX example uses completed five minute closes from October eighth, twenty twenty six. We seed fourteen period average gains and losses with the first fourteen changes, then use Wilder updates. At the highlighted bar, smoothed average gain is approximately zero ...

BAC RSI Explained: Gains, Losses, and Wilder Smoothing

Why Equal Yield Moves Change Bond Prices Differently

https://youtu.be/VTwjGltpgNg

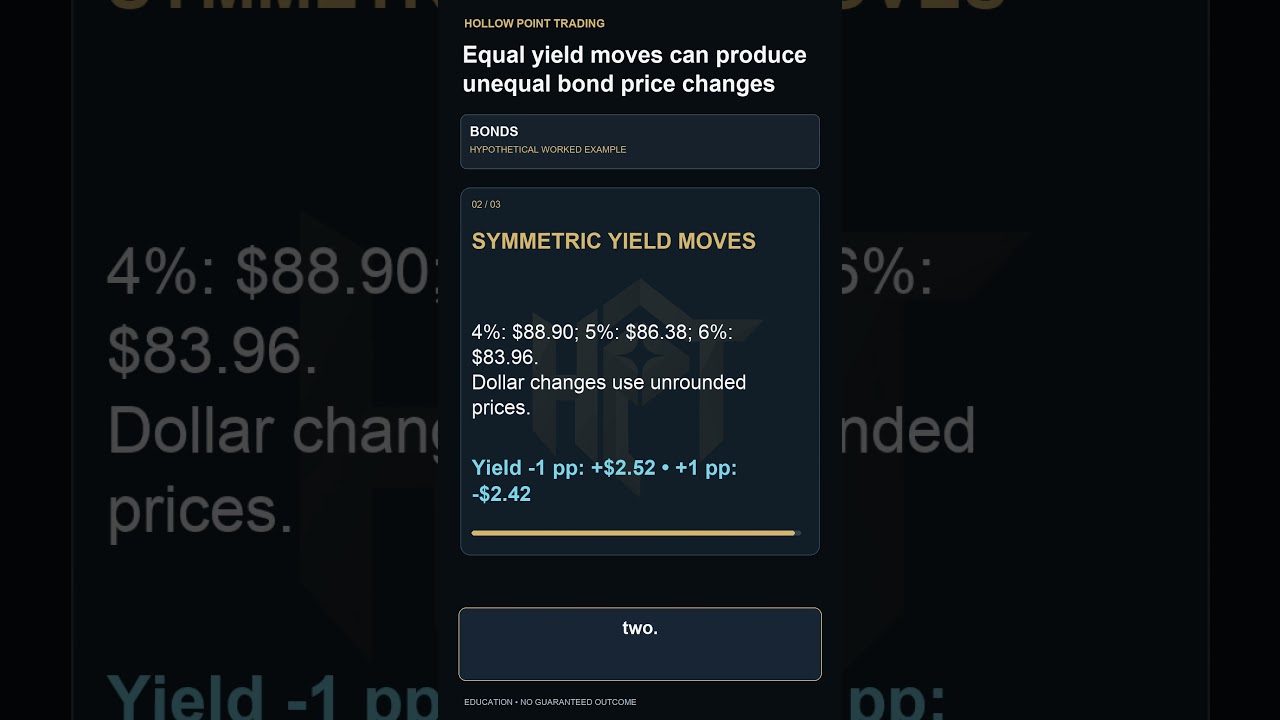
Equal yield moves can produce unequal bond price changes #Shorts


Equal yield changes can produce unequal dollar price changes. Consider a hypothetical default free, noncallable zero coupon bond paying one hundred dollars in three years. Use annual compounding and hold the remaining maturity fixed. At a five percent yield, its price is about eighty six dollars thirty eight cents. At four percent, it is eighty ...

Why Equal Yield Moves Change Bond Prices Differently

Chips Fall, S&P Holds: Read the Market Before Stocks

https://youtu.be/98owZ_btjxg

Stop Picking Stocks Backwards: Chips Fall, S&P Holds | Oct 12


Start with the index, then the sector, then the stock. October 12 shows why: SOXX fell 2.60% while SPY slipped just 0.06%. A favorite ticker can be in the wrong part of the market for the setup you want.

This HPT recap explains index membership and weight, sector and industry comparisons, IGV/SOXX and SOXX/QQQ relative strength, breadth, peer s...

Chips Fall, S&P Holds: Read the Market Before Stocks

MSFT Keltner: Why 2 ATRs Aren’t a 95% Interval

https://youtu.be/UU_H_9R8FxQ

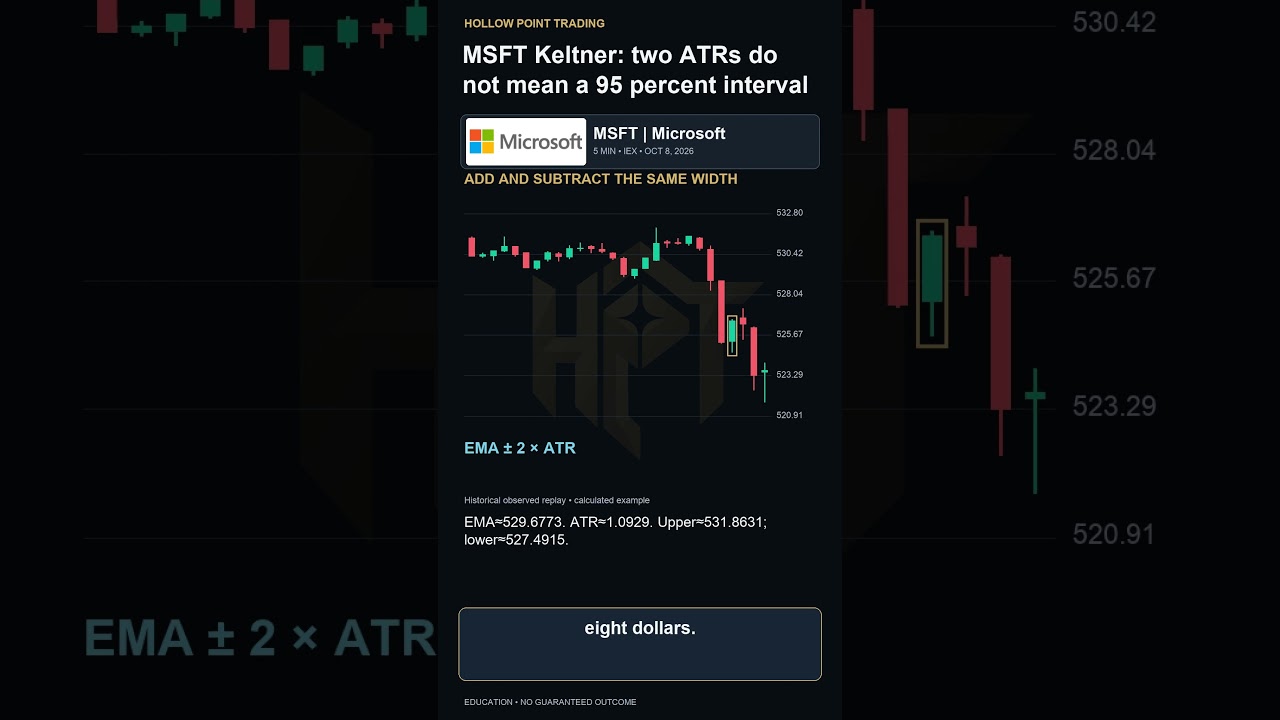
MSFT Keltner: two ATRs do not mean a 95 percent interval #Shorts


Two average true ranges do not automatically create a ninety five percent probability interval. This historical Microsoft IEX replay uses completed five minute bars from October eighth, twenty twenty six. We declare a twenty period close EMA seeded at the first available close, and twenty period Wilder ATR seeded with twenty true ranges. At the ...

MSFT Keltner: Why 2 ATRs Aren’t a 95% Interval

Why Larger Samples Narrow Mean Uncertainty

https://youtu.be/e_fedpySxJU

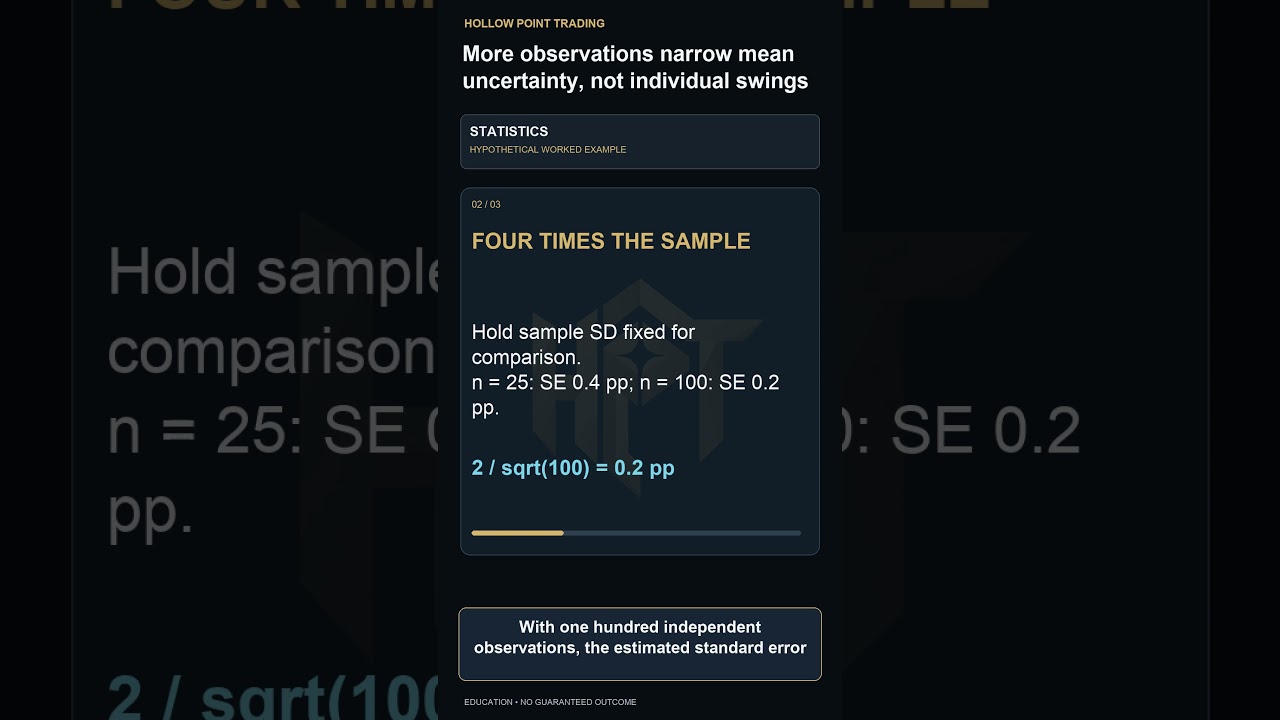
More observations narrow mean uncertainty, not individual swings #S...


A more precise average does not mean individual returns became calmer. Consider a hypothetical sample of independent observations with a sample standard deviation of two percentage points. With twenty five observations, the estimated standard error of the mean is zero point four percentage points. Hold that sample standard deviation fixed for co...

Why Larger Samples Narrow Mean Uncertainty

Heikin Ashi Close vs. Actual Trade Price

https://youtu.be/R7RSUKUhwhE

DE Heikin Ashi: a calculated close is not the tape close #Shorts


A Heikin Ashi close is a calculated average, not the last observed trade price. The chart here remains standard observed candles. This historical Deere IEX example uses a closed five minute interval from October eighth, twenty twenty six. The interval opens at six forty three point seven six five. Its high is six forty four point one five, its l...

Heikin Ashi Close vs. Actual Trade Price

Cash Conversion Cycle: How Supplier Terms Affect Cash Flow

https://youtu.be/TJmX6kBlnuo

Supplier payment timing changes the cash conversion cycle #Shorts


Profit margin does not tell you how long cash stays tied up in operations. A simplified cash conversion cycle adds inventory days and receivable days, then subtracts payable days. It estimates the timing between paying suppliers and collecting sales cash. Imagine inventory lasts fifty days, customers pay thirty days after sale, and suppliers are...

Cash Conversion Cycle: How Supplier Terms Affect Cash Flow

XOM ATR Percent: Compare Stock Volatility Fairly

https://youtu.be/BS6mJvdMTF8

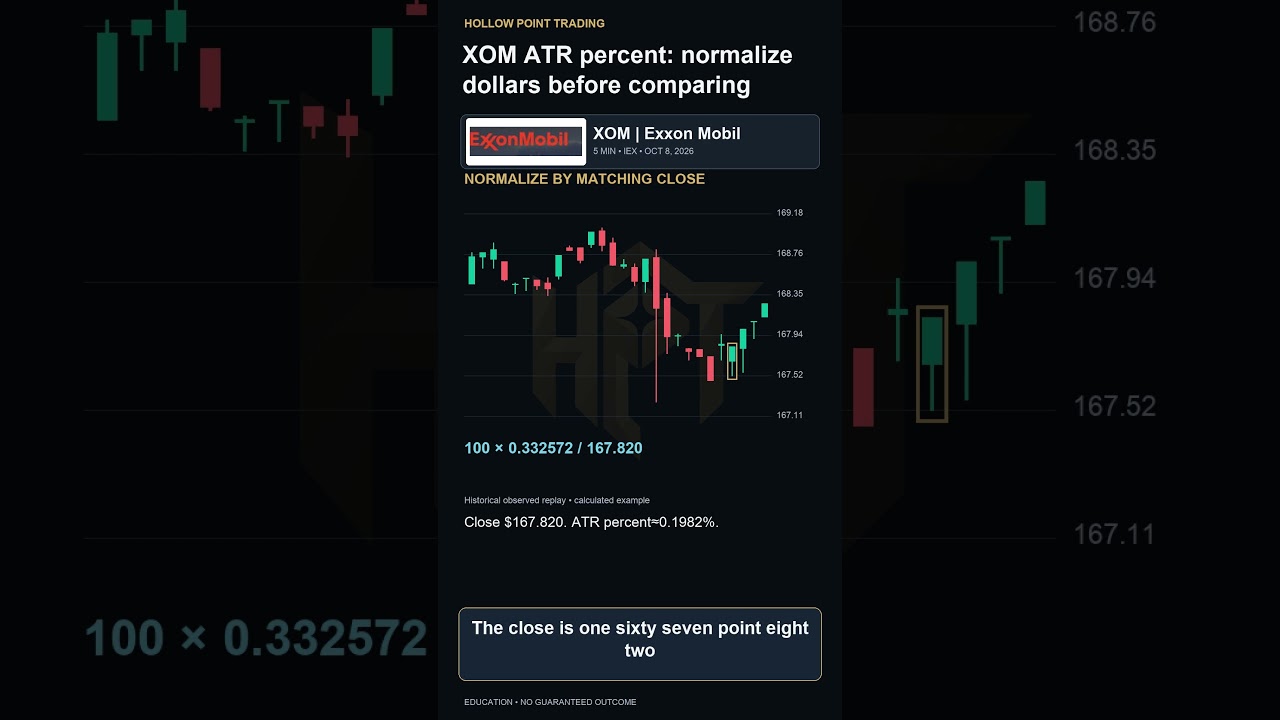
XOM ATR percent: normalize dollars before comparing #Shorts


A dollar range needs a price denominator before comparing differently priced stocks. This historical Exxon Mobil IEX example uses completed five minute bars from October eighth, twenty twenty six. We seed fourteen period Wilder ATR with the first fourteen available true ranges, then update recursively. At the highlighted bar, ATR is approximatel...

XOM ATR Percent: Compare Stock Volatility Fairly

Tracking Error vs. Underperformance: Key Differences

https://youtu.be/GOZwEXeHEuw

A low tracking error can coexist with consistent underperformance #...


A fund can track consistently and still lag its benchmark. Tracking difference describes a return gap over a stated period. Tracking error measures variability of periodic fund minus benchmark returns. Those are different questions. Imagine four hypothetical monthly active returns, each negative one tenth of a percentage point. Their variation a...

Tracking Error vs. Underperformance: Key Differences

AMD MACD Explained: Why the Histogram Subtracts Again

https://youtu.be/rDMByxUOn-I

AMD MACD: the histogram subtracts again #Shorts


The MACD line and its histogram subtract different things. This historical AMD IEX example uses completed five minute closes from October eighth, twenty twenty six. We declare twelve and twenty six period exponential averages, seeded at the first available close. The signal is a nine period exponential average of their difference, seeded at zero...

AMD MACD Explained: Why the Histogram Subtracts Again

Put-Call Parity Explained: The Present Value of the Strike

https://youtu.be/jNESODAk0yo

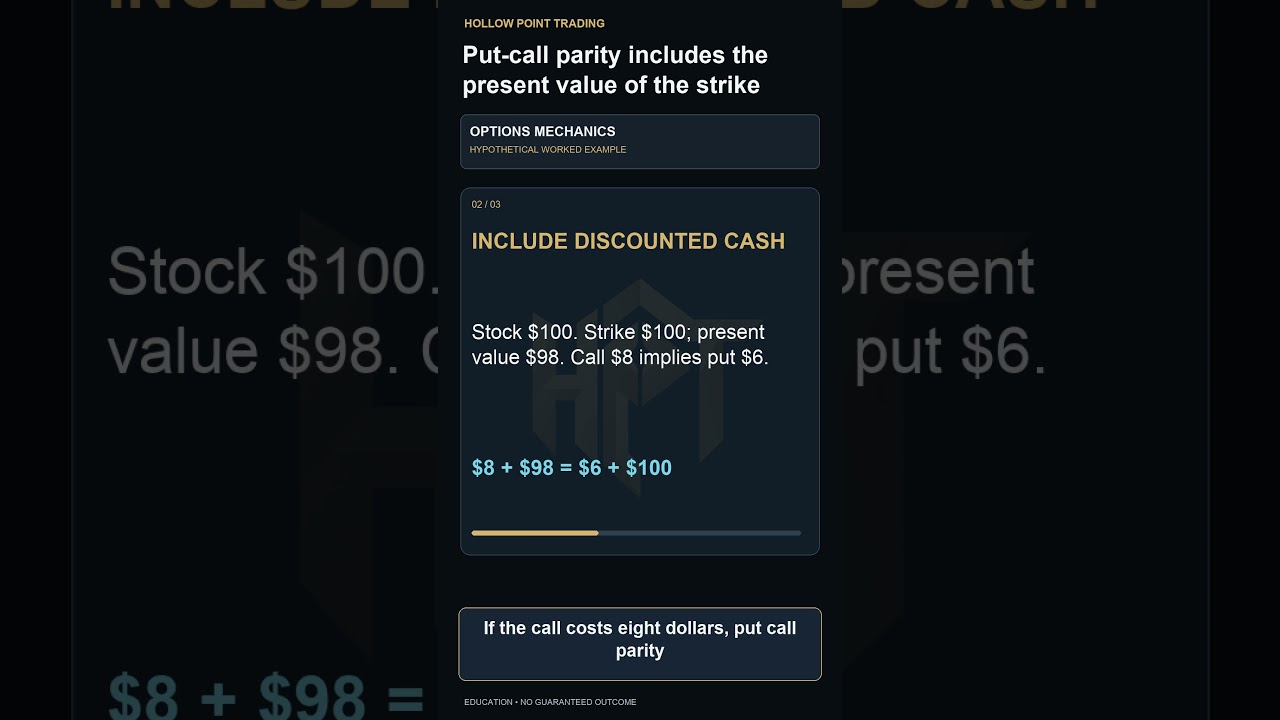
Put-call parity includes the present value of the strike #Shorts


A call premium and a put premium are connected through more than their difference. Consider a hypothetical European call and put on the same underlying, with the same strike and expiration. Assume no dividends and an ideal market without transaction costs or borrowing restrictions. The stock costs one hundred dollars. The strike is one hundred d...

Put-Call Parity Explained: The Present Value of the Strike

Why Testing 20 Trading Ideas Raises False Discovery Risk

https://youtu.be/8wv6Jg9ISHg

Twenty tests create more chances for a false discovery #Shorts


Testing twenty ideas gives noise twenty chances to look convincing. Consider a hypothetical example where every null hypothesis is true. Each test has a five percent false positive rate, and all twenty tests are independent. These are declared assumptions, not facts about trading strategies. The chance of no false positives is zero point nine fi...

Why Testing 20 Trading Ideas Raises False Discovery Risk

JPM ADL Explained: Negative Increments Aren’t Outflows

https://youtu.be/gmOg0bynbyE

JPM ADL: a negative increment is not dollars leaving the stock #Shorts


A negative accumulation distribution contribution is not measured dollars leaving a stock. This historical JPMorgan IEX replay uses a completed five minute bar from October eighth, twenty twenty six. Its high is three twenty nine point four seven; its low is three twenty eight point eight one. The close is three twenty nine point zero seven. It ...

JPM ADL Explained: Negative Increments Aren’t Outflows

Costco ATR: How Wilder Smoothing Remembers Ranges

https://youtu.be/QYL8EaYWMxw

COST ATR: Wilder smoothing remembers earlier ranges #Shorts


Two fourteen period ATR readings can differ because their smoothing differs. This historical Costco IEX example uses completed five minute bars from October eighth, twenty twenty six. We seed Wilder smoothing with the first fourteen available true ranges, then update recursively. Before the highlighted bar, the smoothed range is approximately on...

Costco ATR: How Wilder Smoothing Remembers Ranges

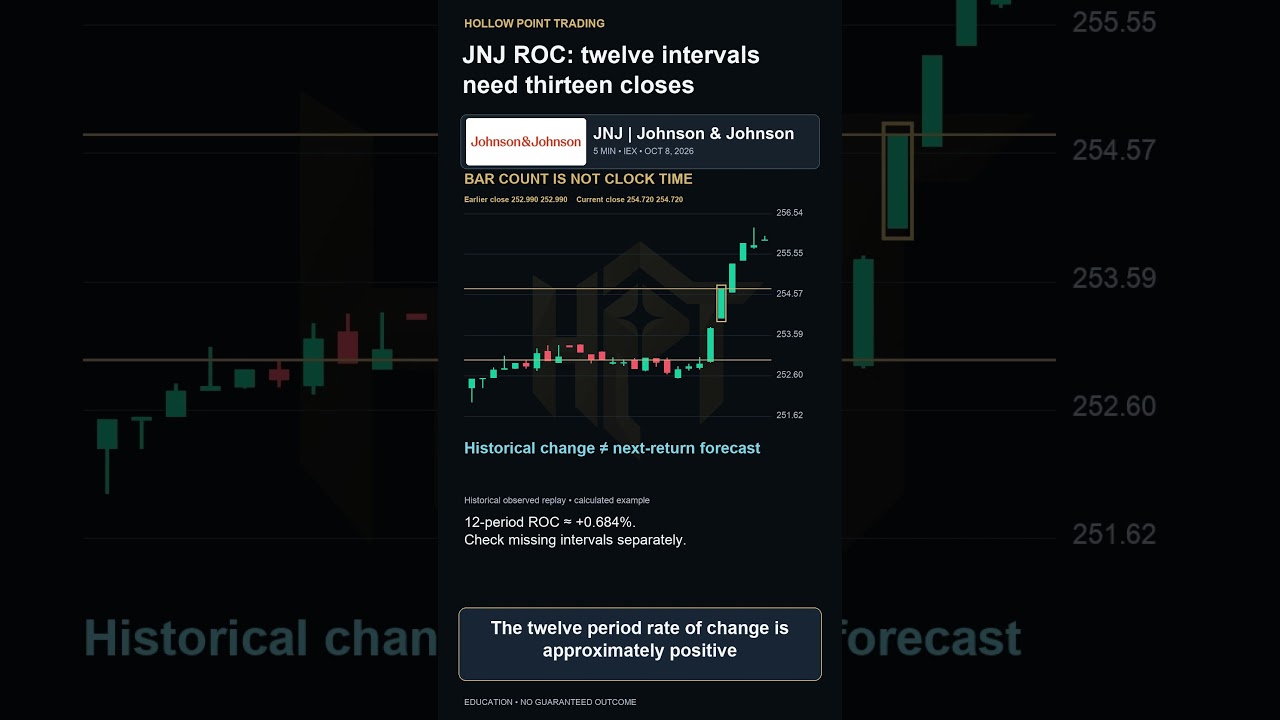
JNJ ROC Explained: Why 12 Periods Need 13 Closes

https://youtu.be/TISW0dRmxAQ

JNJ ROC: twelve intervals need thirteen closes #Shorts


A twelve period rate of change needs a current close and a close twelve bars earlier. That is thirteen closing observations, not twelve. This historical Johnson and Johnson IEX replay uses completed five minute bars from October eighth, twenty twenty six. The highlighted close is two fifty four point seven two. Twelve bars earlier, the close was...

JNJ ROC Explained: Why 12 Periods Need 13 Closes

BAC Aroon Explained: Recency vs. Price Movement

https://youtu.be/hTQ8Oal21dw

BAC Aroon: recency is not the size of a price move #Shorts


Aroon measures how recently an extreme occurred, not how many dollars price moved. This historical Bank of America IEX replay uses fourteen completed five minute bars from October eighth, twenty twenty six. We declare a fourteen bar window including the highlighted bar. The window high is fifty two point seven one, on the current bar. Zero bars ...

BAC Aroon Explained: Recency vs. Price Movement

GOOGL CCI Explained: Mean Deviation vs. Standard Deviation

https://youtu.be/FzrnVSszN9Y

GOOGL CCI: mean deviation is not standard deviation #Shorts


The denominator in this CCI example is mean absolute deviation, not standard deviation. This historical Alphabet IEX chart uses five minute bars from October eighth, twenty twenty six. We explicitly choose typical price: high plus low plus close, divided by three. Across twenty completed bars, average typical price is approximately three forty n...

GOOGL CCI Explained: Mean Deviation vs. Standard Deviation

XOM Williams %R Explained: Measure Distance from the High

https://youtu.be/7Fr-J3uTxh4

XOM Williams percent R: measure distance from the window high #Shorts


A negative Williams percent R reading is not a negative stock return. This historical Exxon Mobil IEX example uses fourteen completed five minute bars from October eighth, twenty twenty six. The window high is one sixty nine point zero three five. The low is one sixty seven point two five. The highlighted close is one sixty seven point eight two...

XOM Williams %R Explained: Measure Distance from the High