Hollow Point Trading
Hollow Point Trading Discord server banner

Hollow Point Trading Updates & Events

Server Updates & Events

Announcements

Slower Growth Still Means Economic Expansion

https://youtu.be/ugY0ESJmWdI

A slowing growth rate can still mean expansion #Shorts


Slower growth does not automatically mean a shrinking economy. Consider a hypothetical output index that rises from one hundred to one hundred four, then to one hundred six. Output increased in both periods. The first growth rate is four percent. The second is two divided by one hundred four, about one point nine two percent. Growth slowed, but ...

Slower Growth Still Means Economic Expansion

Bullish Harami: Mark the Invalidation Level

https://youtu.be/Emp-P3SX0SI

Bullish harami: Mark the Invalidation Before the Next Candle #Shorts


Define the pattern low before interpreting this bullish harami. Look for a small real body contained inside a preceding large red real body, after a decline. Watch subsequent price cross that boundary. Invalidation is new evidence; a structural level does not guarantee a stop fill at its exact price.

Original Hollow Point Trading animation usin...

Bullish Harami: Mark the Invalidation Level

Bullish Harami Failure: Watch the Price Response

https://youtu.be/mc5-L9ExuwQ

Bullish harami Failed: Watch the Price Response #Shorts


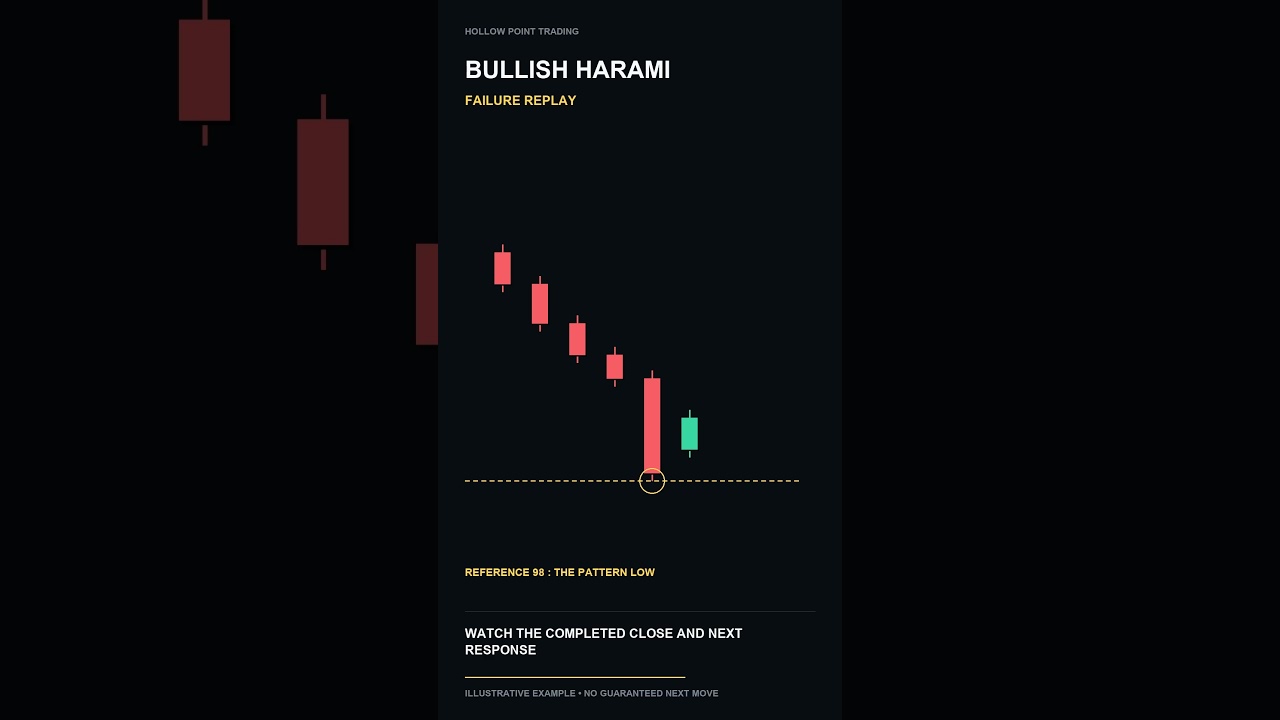
Watch a bullish harami form after a decline, then fail. Its geometry is a small real body contained inside a preceding large red real body. Contrary follow-through crosses the pattern low, challenging the interpretation. A familiar pattern name does not guarantee the next move.

Original Hollow Point Trading animation using an illustrative price...

Bullish Harami Failure: Watch the Price Response

Bearish Engulfing Failure: Read the Price Response

https://youtu.be/rv9nZsyKq8g

Bearish engulfing Failed: Watch the Price Respo nse #Shorts


Watch a bearish engulfing form after rising prices, then fail. Its geometry is a red real body that encloses the preceding green real body. Contrary follow-through crosses the two-candle high, challenging the interpretation. A familiar pattern name does not guarantee the next move.

Original Hollow Point Trading animation using an illustrative p...

Bearish Engulfing Failure: Read the Price Response

Bearish Harami Failure: Watch the Price Response

https://youtu.be/u43vwJa4E68

Bearish harami Failed: Watch the Price Response #Shorts


Watch a bearish harami form after an advance, then fail. Its geometry is a small real body contained inside a preceding large green real body. Contrary follow-through crosses the pattern high, challenging the interpretation. A familiar pattern name does not guarantee the next move.

Original Hollow Point Trading animation using an illustrative p...

Bearish Harami Failure: Watch the Price Response

Bearish Engulfing: Mark Invalidation Before the Next Candle

https://youtu.be/U1dua6w0VYA

Bearish engulfing: Mark the Invalidation Before the Next Candle #Sh...


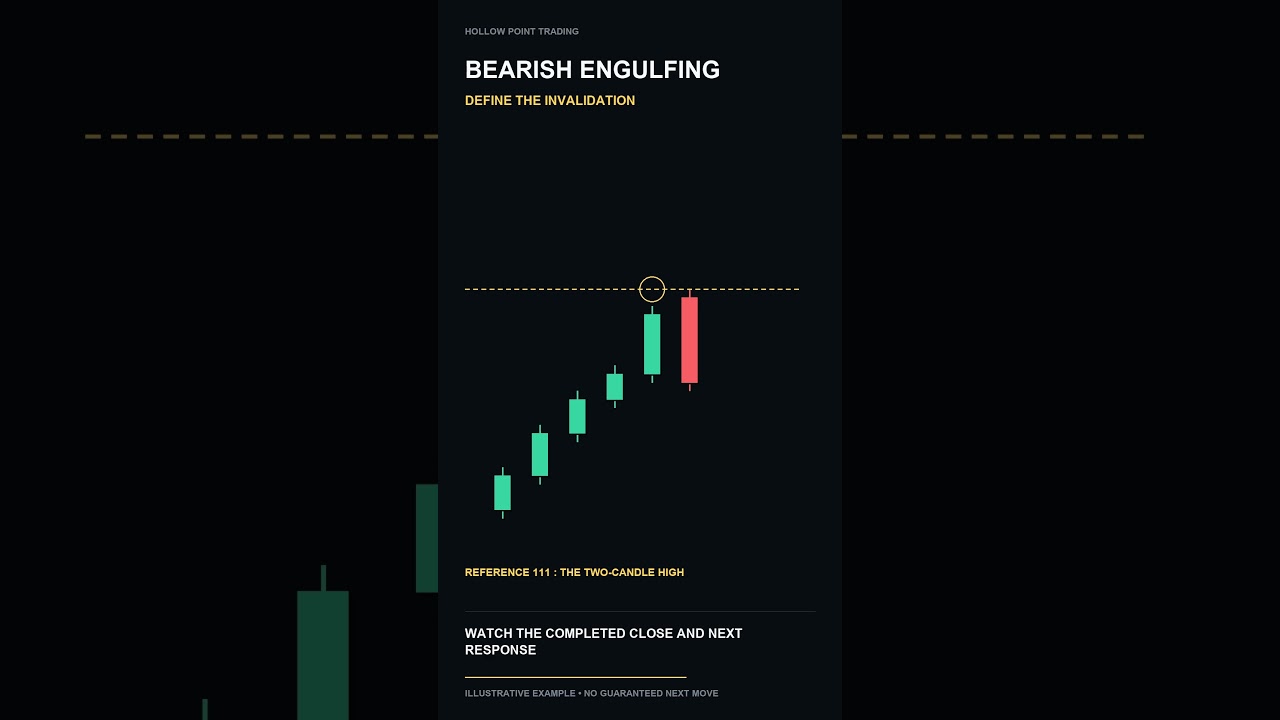
Define the two-candle high before interpreting this bearish engulfing. Look for a red real body that encloses the preceding green real body, after rising prices. Watch subsequent price cross that boundary. Invalidation is new evidence; a structural level does not guarantee a stop fill at its exact price.

Original Hollow Point Trading animation ...

Bearish Engulfing: Mark Invalidation Before the Next Candle

Hanging Man Pattern Failure: Watch Price Response

https://youtu.be/at6a-Z4e4ZM

Hanging man Failed: Watch the Price Response #Shorts


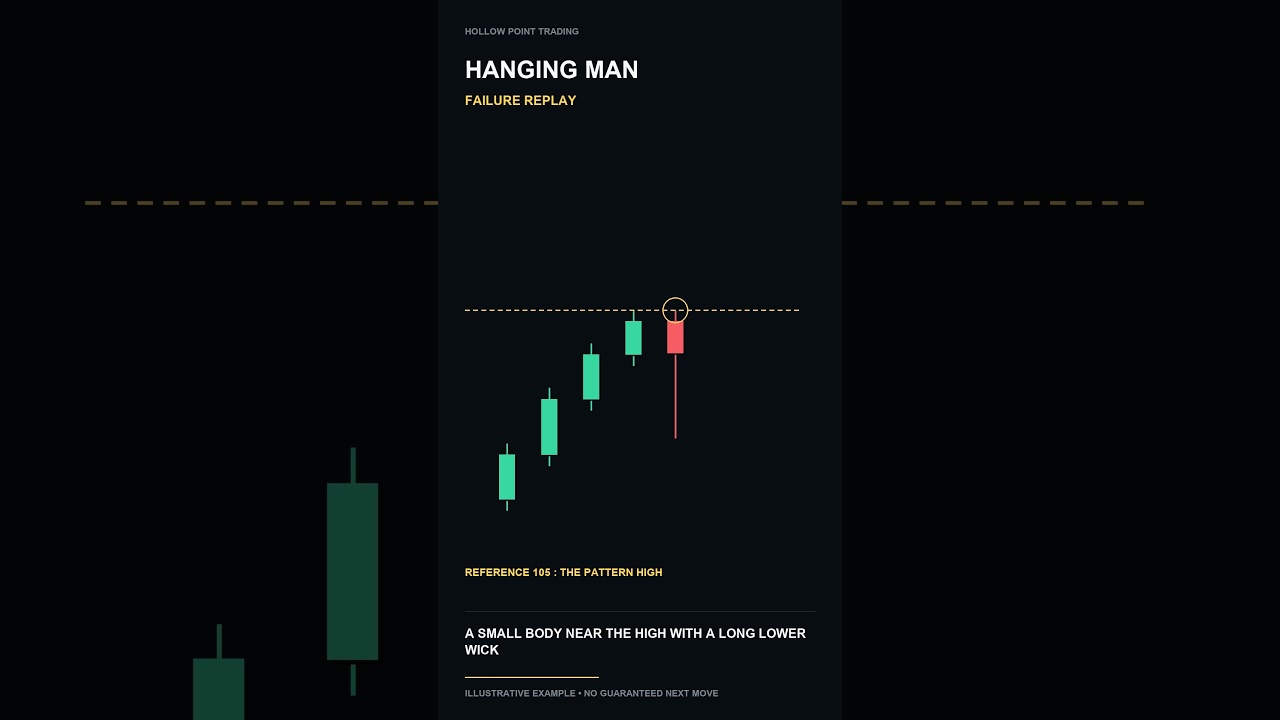
Watch a hanging man form after an advance, then fail. Its geometry is a small body near the high with a long lower wick. Contrary follow-through crosses the pattern high, challenging the interpretation. A familiar pattern name does not guarantee the next move.

Original Hollow Point Trading animation using an illustrative price sequence and HPT ...

Hanging Man Pattern Failure: Watch Price Response

Inverted Hammer Trading: Set Invalidation Levels

https://youtu.be/YR7jf-798_I

Inverted hammer: Mark the Invalidation Before the Next Candle #Shorts


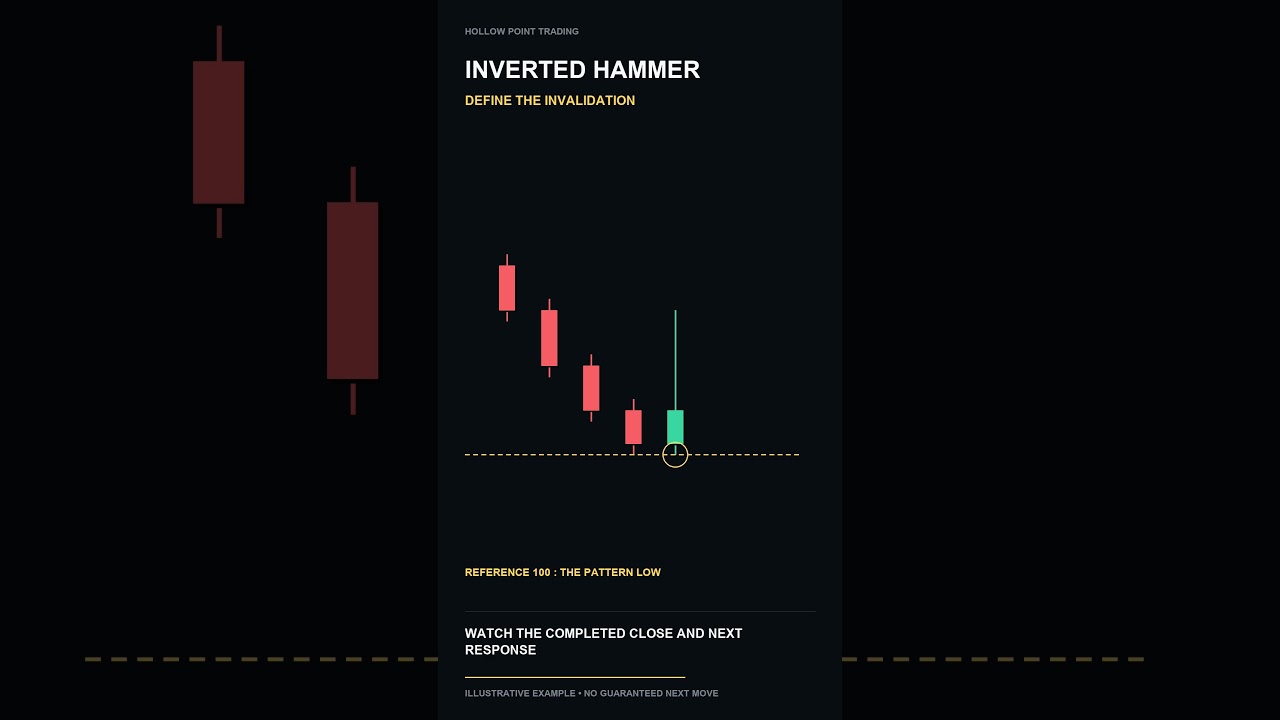
Define the pattern low before interpreting this inverted hammer. Look for a small body near the low with a long upper wick, after a decline. Watch subsequent price cross that boundary. Invalidation is new evidence; a structural level does not guarantee a stop fill at its exact price.

Original Hollow Point Trading animation using an illustrative...

Inverted Hammer Trading: Set Invalidation Levels

How to Read a Hanging Man Candlestick Pattern

https://youtu.be/S-0tQFhOW2A

320 1080p


Define the pattern high before interpreting this hanging man. Look for a small body near the high with a long lower wick, after an advance. Watch subsequent price cross that boundary. Invalidation is new evidence; a structural level does not guarantee a stop fill at its exact price.

Original Hollow Point Trading animation using an illustrative ...

How to Read a Hanging Man Candlestick Pattern

Bullish Engulfing Failure: Read the Price Response

https://youtu.be/UuU9593tkC0

Bullish engulfing Failed: Watch the Price Response #Shorts


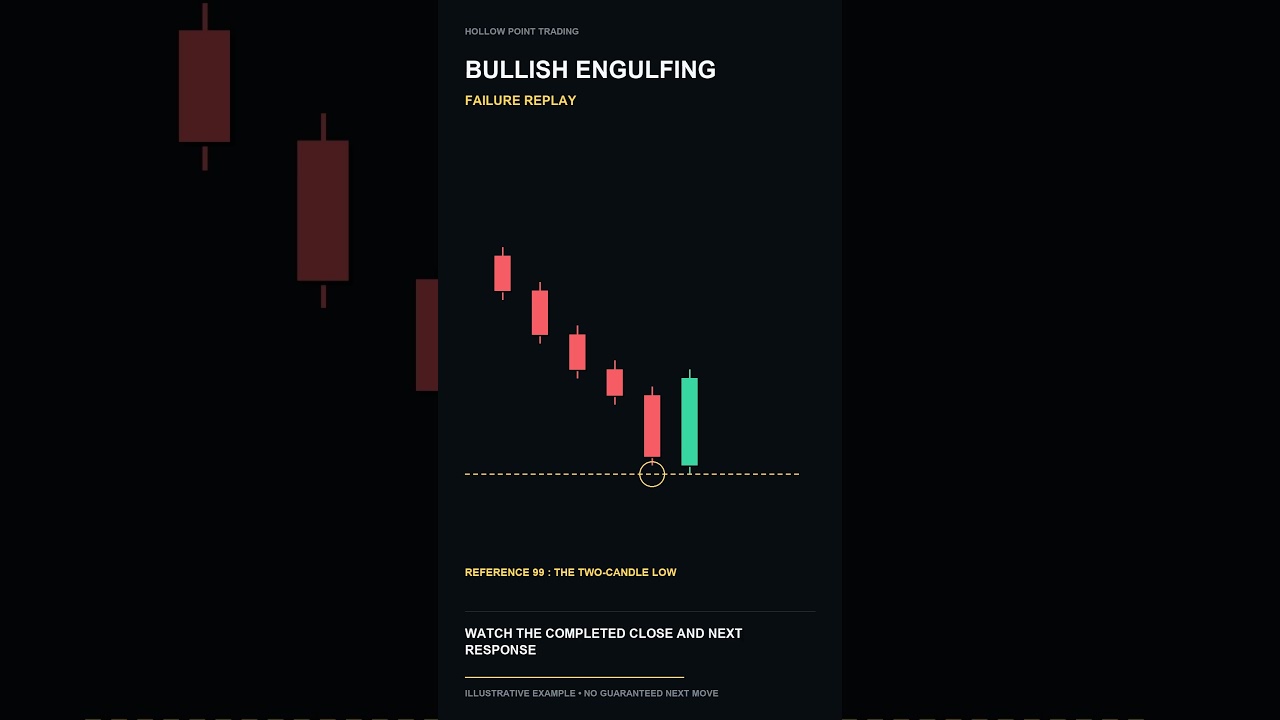
Watch a bullish engulfing form after declining prices, then fail. Its geometry is a green real body that encloses the preceding red real body. Contrary follow-through crosses the two-candle low, challenging the interpretation. A familiar pattern name does not guarantee the next move.

Original Hollow Point Trading animation using an illustrative...

Bullish Engulfing Failure: Read the Price Response

Bullish Engulfing: Identify the Two-Candle Low

https://youtu.be/wZY6p5xWt8Q

325 1080p


Define the two-candle low before interpreting this bullish engulfing. Look for a green real body that encloses the preceding red real body, after declining prices. Watch subsequent price cross that boundary. Invalidation is new evidence; a structural level does not guarantee a stop fill at its exact price.

Original Hollow Point Trading animatio...

Bullish Engulfing: Identify the Two-Candle Low

Spot the Real Bearish Harami: Chart Pattern Challenge

https://youtu.be/GdS5wYohDq0

Which Is the Real Bearish harami? Choose Before the Reveal #Shorts


Can you spot the bearish harami before the answer appears? Look for a small real body contained inside a preceding large green real body. Compare both examples carefully. One misses a defining feature. The correct shape is the starting point, not a prediction. Check the preceding trend and the next price response before drawing a conclusion.

Or...

Spot the Real Bearish Harami: Chart Pattern Challenge

Bearish Harami: Wait for the Next Candle to Confirm

https://youtu.be/PPK6XW44XdM

Is This Bearish harami Confirmed Yet? Watch the Next Candle #Shorts


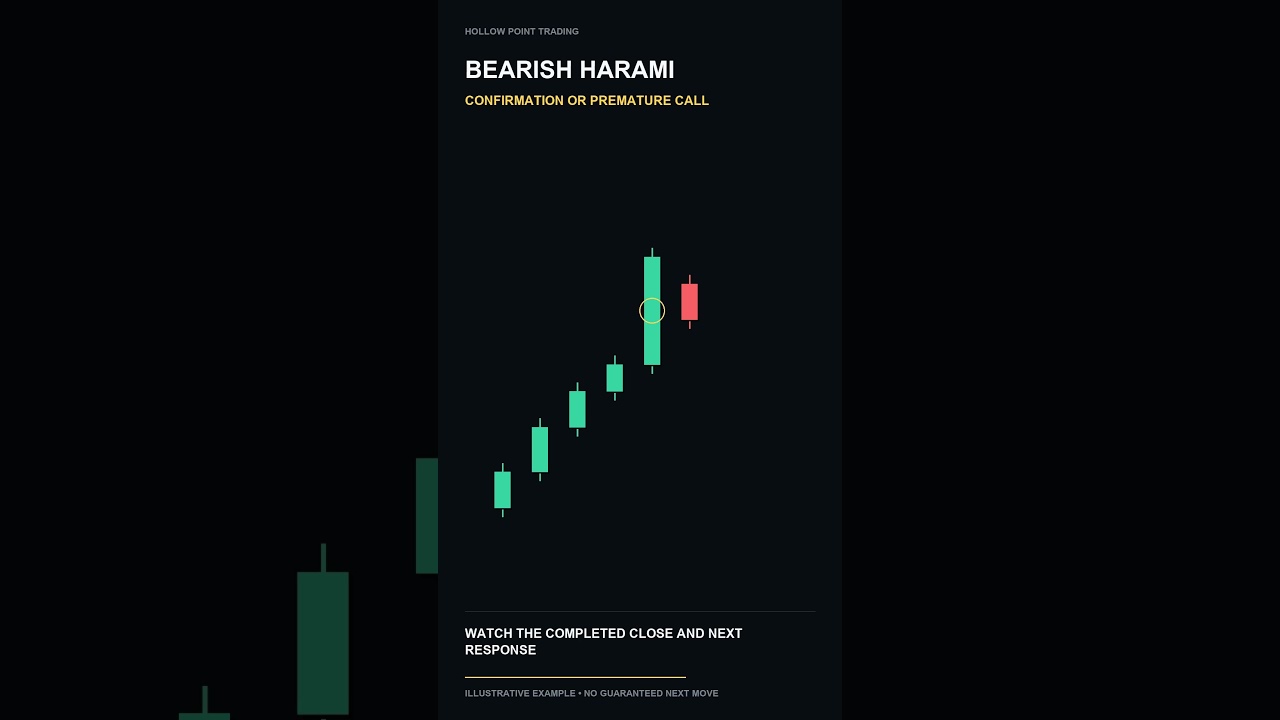
Is this bearish harami ready to interpret, or is the important bar still forming? Its structure is a small real body contained inside a preceding large green real body. Watch the next completed close and the response at the relevant boundary. Follow-through adds evidence, but it cannot guarantee continuation. An unfinished candle can change befo...

Bearish Harami: Wait for the Next Candle to Confirm

Shooting Star Trading: Mark Invalidation Levels

https://youtu.be/O_xxv14vvEw

Shooting star: Mark the Invalidation Before the Next Candle #Shorts


Define the shooting-star high before interpreting this shooting star. Look for a small body near the low and an upper wick at least twice the body, after an advance. Watch subsequent price cross that boundary. Invalidation is new evidence; a structural level does not guarantee a stop fill at its exact price.

Original Hollow Point Trading animat...

Shooting Star Trading: Mark Invalidation Levels

Inverted Hammer: When the Pattern Fails

https://youtu.be/_ISjNQ6WQmw

314 1080p


Watch a inverted hammer form after a decline, then fail. Its geometry is a small body near the low with a long upper wick. Contrary follow-through crosses the pattern low, challenging the interpretation. A familiar pattern name does not guarantee the next move.

Original Hollow Point Trading animation using an illustrative price sequence and HPT...

Inverted Hammer: When the Pattern Fails

Bearish Harami: Why Trend Context Matters

https://youtu.be/wTjmPPha3ho

Bearish harami: Same Shape, Different Trend—What Changes? #Shorts


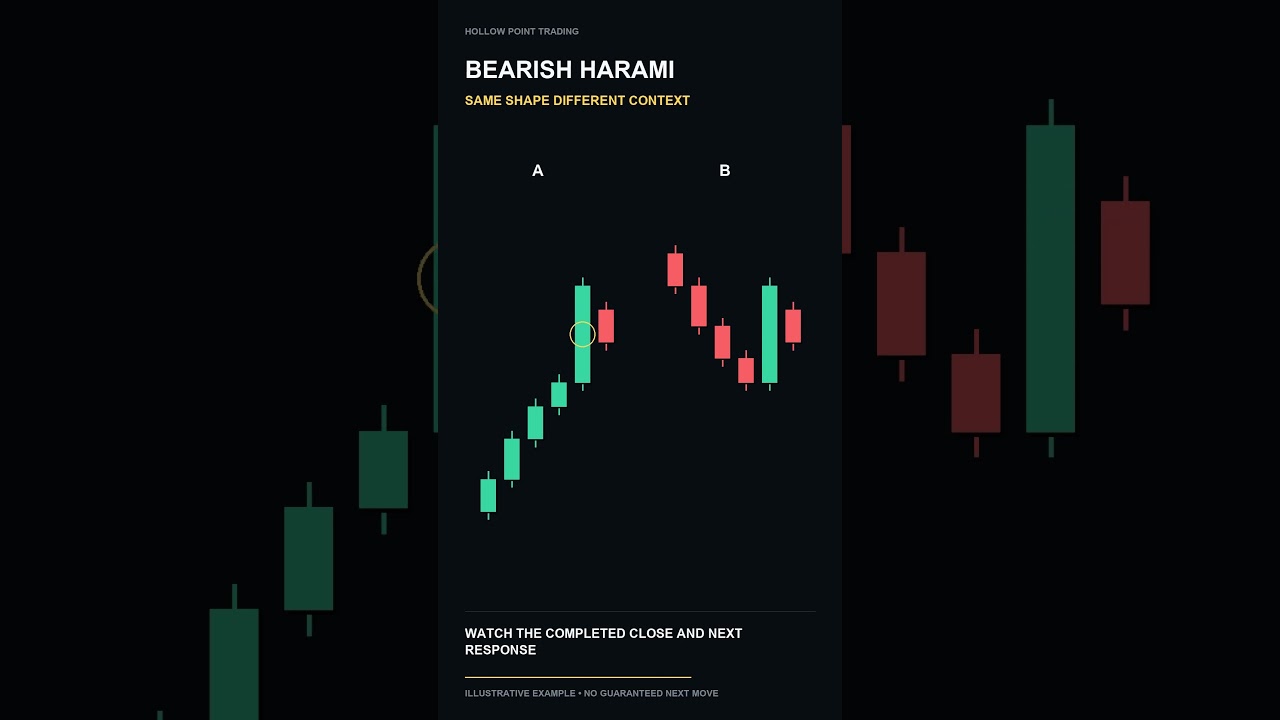
These charts show the same bearish harami geometry. Do they tell the same story? The usual context is after an advance. Now compare that with the second chart. The shape can remain identical while its relevance changes. Read the trend and location first. A familiar name alone does not establish a directional edge.

Original Hollow Point Trading ...

Bearish Harami: Why Trend Context Matters

Bullish Harami: Wait for the Next Candle Close

https://youtu.be/dFEh9tKYdMg

Is This Bullish harami Confirmed Yet? Watch the Next Candle #Shorts


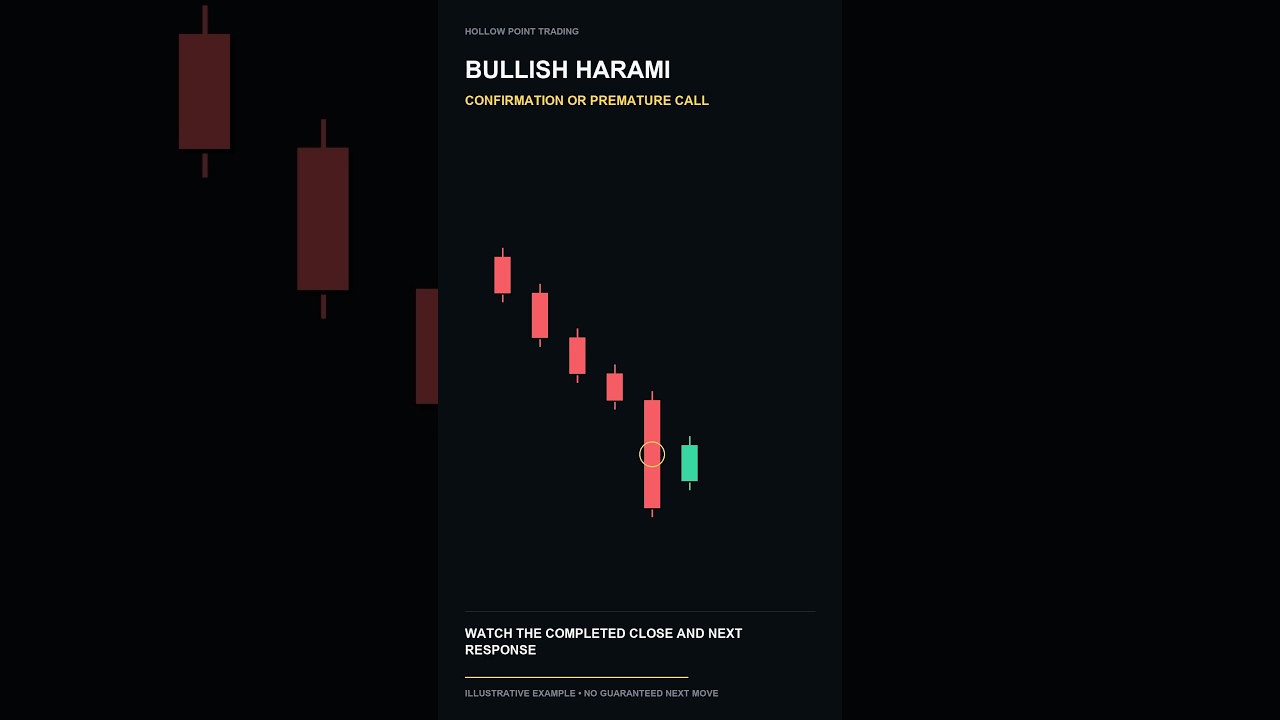
Is this bullish harami ready to interpret, or is the important bar still forming? Its structure is a small real body contained inside a preceding large red real body. Watch the next completed close and the response at the relevant boundary. Follow-through adds evidence, but it cannot guarantee continuation. An unfinished candle can change before...

Bullish Harami: Wait for the Next Candle Close

Spot the Real Bullish Harami: Chart Pattern Guide

https://youtu.be/EnqgjvBYXQQ

Which Is the Real Bullish harami? Choose Before the Reveal #Shorts


Can you spot the bullish harami before the answer appears? Look for a small real body contained inside a preceding large red real body. Compare both examples carefully. One misses a defining feature. The correct shape is the starting point, not a prediction. Check the preceding trend and the next price response before drawing a conclusion.

Orig...

Spot the Real Bullish Harami: Chart Pattern Guide

Bearish Engulfing Pattern: Wait for Confirmation

https://youtu.be/culwdTmMVWI

Looks Bearish. But Is It Confirmed?


A big red candle can look convincing before it closes. This bearish engulfing example shows what to check before calling the pattern complete—and why the next price response matters.

Look for a red real body that encloses the preceding green real body. A forming candle can still change; a completed pattern and follow-through add evidence with...

Bearish Engulfing Pattern: Wait for Confirmation

Bullish Harami: Why Trend Context Matters

https://youtu.be/gb3b5iu5yV8

Bullish harami: Same Shape, Different Trend—What Changes? #Shorts


These charts show the same bullish harami geometry. Do they tell the same story? The usual context is after a decline. Now compare that with the second chart. The shape can remain identical while its relevance changes. Read the trend and location first. A familiar name alone does not establish a directional edge.

Original Hollow Point Trading a...

Bullish Harami: Why Trend Context Matters

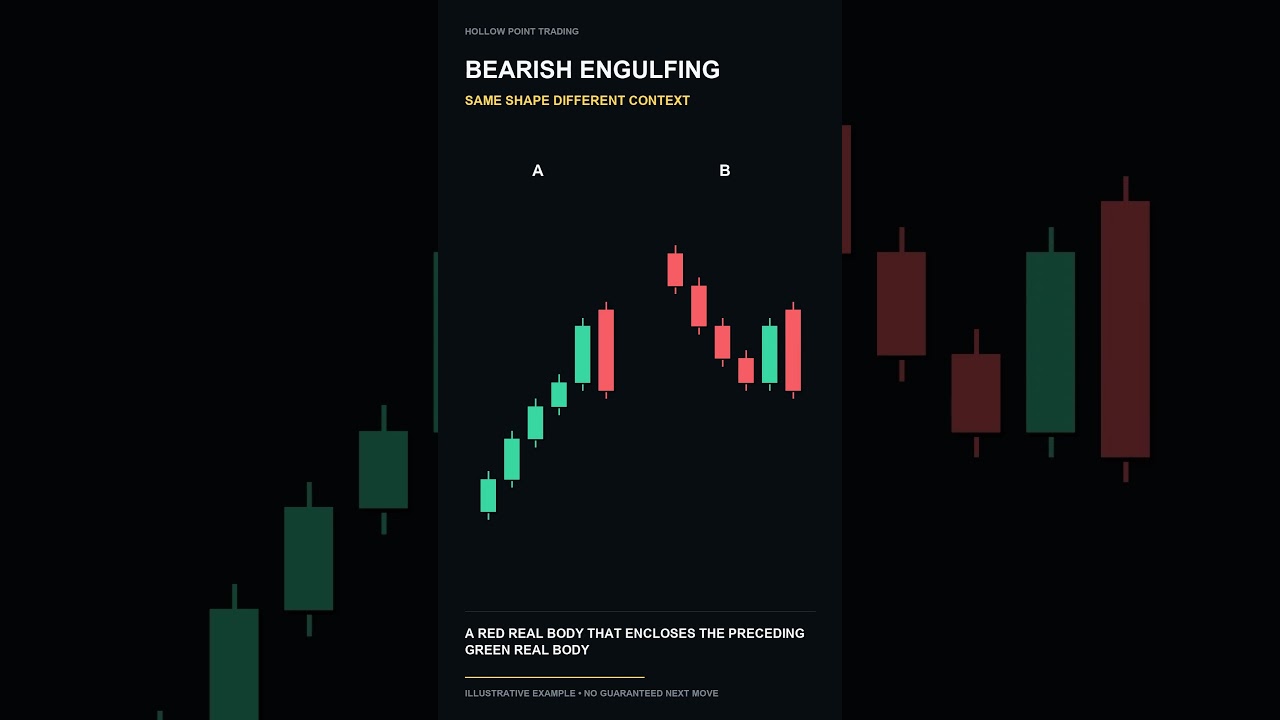
Bearish Engulfing: Why Trend Context Matters

https://youtu.be/LjMY42Liphw

Bearish engulfing: Same Shape, Different Trend—What Changes? #Shorts


The same bearish engulfing geometry can have different relevance. Look for a red real body that encloses the preceding green real body and compare its usual context, after rising prices, with the opposite trend. Read trend and location before assuming a directional edge.

Original Hollow Point Trading animation using an illustrative price sequen...

Bearish Engulfing: Why Trend Context Matters

Hanging Man Candlestick: Wait for Confirmation

https://youtu.be/2ajkM11ktYU

Is This Hanging man Confirmed Yet? Watch the Next Candle #Shorts


Is this hanging man ready to interpret, or is the important bar still forming? Its structure is a small body near the high with a long lower wick. Watch the next completed close and the response at the relevant boundary. Follow-through adds evidence, but it cannot guarantee continuation. An unfinished candle can change before the interval ends.
...

Hanging Man Candlestick: Wait for Confirmation

Bullish Engulfing: Is the Signal Confirmed?

https://youtu.be/KjpMkfkqClE

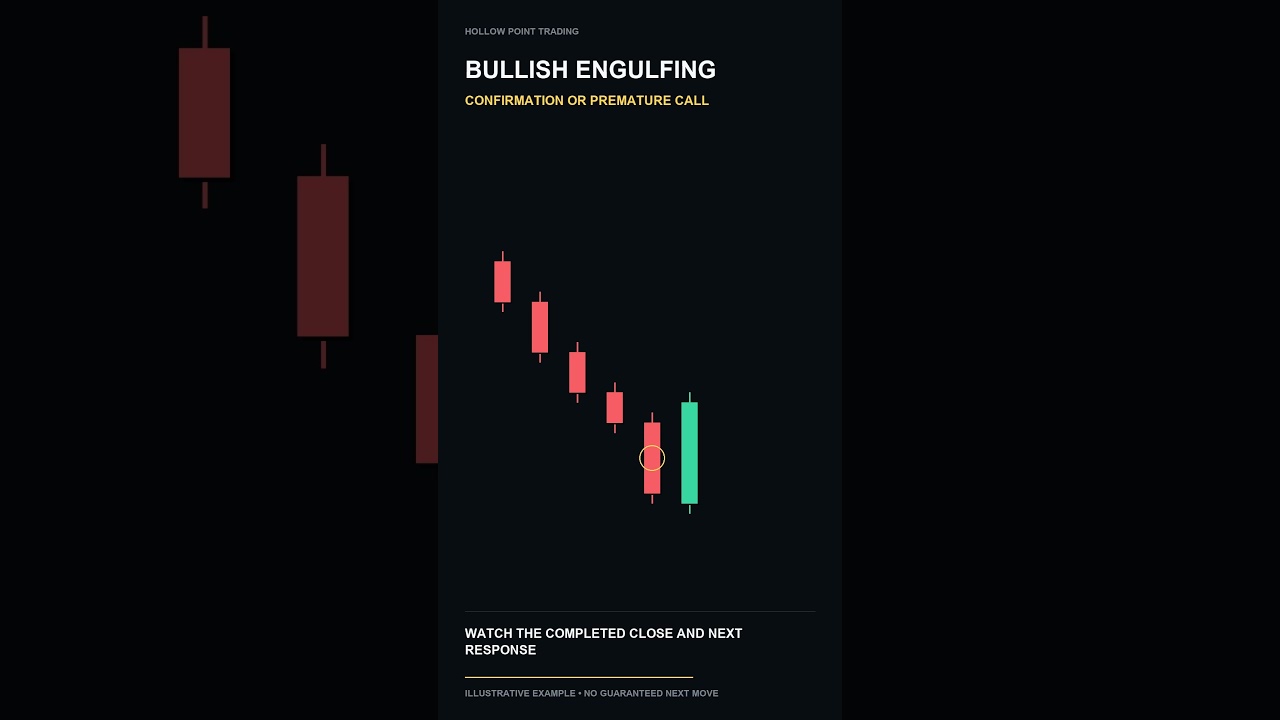
Is This Bullish engulfing Confirmed Yet? Watch the Next Candle #Shorts


Is this bullish engulfing ready to interpret, or is the important bar still forming? Its structure is a green real body that encloses the preceding red real body. Watch the next completed close and the response at the relevant boundary. Follow-through adds evidence, but it cannot guarantee continuation. An unfinished candle can change before the...

Bullish Engulfing: Is the Signal Confirmed?

Bullish Engulfing Patterns: Context Matters

https://youtu.be/RlPSQTVXBDM

Bullish Engulfing: Same Shape, Different Context #Shorts


These charts show the same bullish engulfing geometry. Do they tell the same story? The usual context is after declining prices. Now compare that with the second chart. The shape can remain identical while its relevance changes. Read the trend and location first. A familiar name alone does not establish a directional edge.

Original Hollow Point...

Bullish Engulfing Patterns: Context Matters

Spot the Real Bullish Engulfing Pattern

https://youtu.be/XSct0Pxr9A0

Which Is the Real Bullish engulfing? Choose Before the Reveal #Shorts


Can you spot the bullish engulfing before the answer appears? Look for a green real body that encloses the preceding red real body. Compare both examples carefully. One misses a defining feature. The correct shape is the starting point, not a prediction. Check the preceding trend and the next price response before drawing a conclusion.

Original...

Spot the Real Bullish Engulfing Pattern