Hollow Point Trading
Hollow Point Trading Discord server banner

Hollow Point Trading Updates & Events

Server Updates & Events

Announcements

Stop Orders: Why Your Exit Price Isn’t Guaranteed

https://youtu.be/G_auf2kVrLs

Your stop price is a trigger, not a guaranteed fill #Shorts


A stop price is not a guaranteed exit price. Imagine buying a stock at fifty dollars and placing a sell stop at forty eight. Your planned difference is two dollars per share, before costs. Now imagine news arrives overnight and the next available execution is forty five dollars. Once triggered, a regular stop becomes a market order. In this hypo...

Stop Orders: Why Your Exit Price Isn’t Guaranteed

Yield Curve Steepening: Two Paths Explained

https://youtu.be/alpF2J6Vv6k

A yield curve can steepen through two different paths #Shorts


A steeper yield curve does not tell you which end moved. In a hypothetical example, a short maturity yields four percent and a long maturity yields five percent. The long minus short spread is one percentage point. One path lowers the short yield to three percent while the long yield stays five. Another leaves the short yield at four while the l...

Yield Curve Steepening: Two Paths Explained

Why Producer Inflation Doesn’t Predict Consumer Prices

https://youtu.be/XkFjkP-t-nA

Producer inflation is not a mechanical forecast of consumer inflati...


A producer price increase does not translate one for one into consumer inflation. Producer indexes measure selling prices received by domestic producers. Consumer indexes measure prices paid by consumers. Coverage, weights, and pricing stages differ. Imagine one product sells for one hundred dollars and includes twenty dollars of a particular in...

Why Producer Inflation Doesn’t Predict Consumer Prices

Customer Concentration Risk: A $40M Revenue Example

https://youtu.be/gAN1rrYpXu8

A growing business can depend heavily on one customer #Shorts


Total revenue can hide dependence on one customer. Imagine a business with one hundred million dollars of annual revenue. One customer accounts for forty million, or forty percent. If that customer cuts purchases in half and everything else stays unchanged, revenue falls by twenty million dollars to eighty million. This is a sensitivity scenario...

Customer Concentration Risk: A $40M Revenue Example

Why 10 Stock Holdings Can Still Share One Risk

https://youtu.be/XD5WQOqimNE

Ten holdings can still share one major risk #Shorts


Ten holdings do not automatically mean ten independent risks. Imagine ten equal positions, each worth one thousand dollars. If all depend on the same industry, a shared shock can affect every holding. In a hypothetical stress scenario, each position falls twenty percent. The ten thousand dollar portfolio loses two thousand dollars. Adding more n...

Why 10 Stock Holdings Can Still Share One Risk

Why Profit Growth Can Shrink Earnings Per Share

https://youtu.be/ZT5BNVQ57AI

Profit growth can disappear on a per-share basis #Shorts


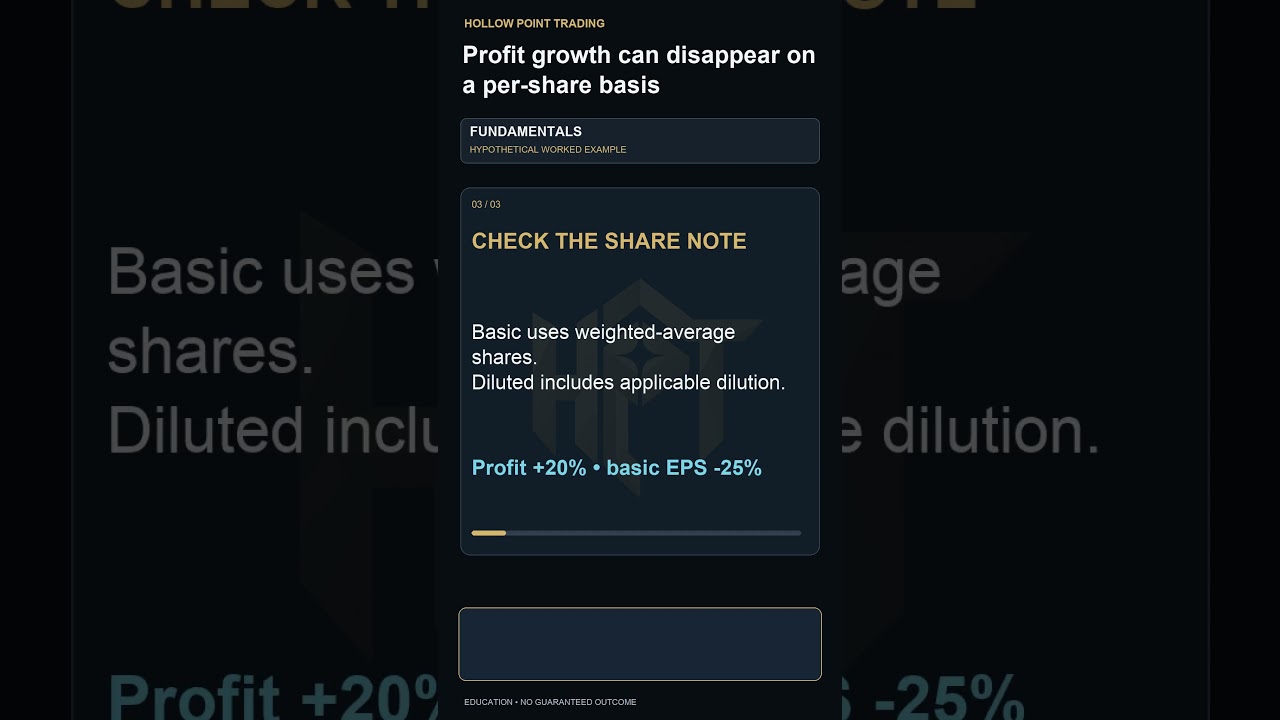
A company can earn more while each share earns less. In a hypothetical year, income available to common shareholders is ten million dollars, with five million weighted average common shares. Basic earnings per share is two dollars. Next year, common earnings rise to twelve million dollars, but weighted average shares rise to eight million. Basic...

Why Profit Growth Can Shrink Earnings Per Share

Capital Intensity and Free Cash Flow Explained

https://youtu.be/rjWb-AGFgzs

How capital intensity changes cash generation #Shorts


Two businesses can produce the same operating cash flow and leave different amounts after equipment spending. In a hypothetical year, both generate twenty million dollars from operations. Business A spends five million on property and equipment. Business B spends fifteen million. Subtract those purchases from operating cash flow. The simplified ...

Capital Intensity and Free Cash Flow Explained

Core Inflation Explained: What It Excludes

https://youtu.be/O7YS45iPFCA

Core inflation excludes categories not household expenses #Shorts


Core inflation does not mean food and energy stopped costing money. The consumer price index for all items includes those categories. A commonly reported core index excludes food and energy to examine price changes outside those relatively volatile components. Imagine a simplified basket with eighty percent weight outside food and energy and twe...

Core Inflation Explained: What It Excludes

Why a Pay Raise May Not Boost Purchasing Power

https://youtu.be/cvLkBvs4eHk

A pay raise can still leave purchasing power lower #Shorts


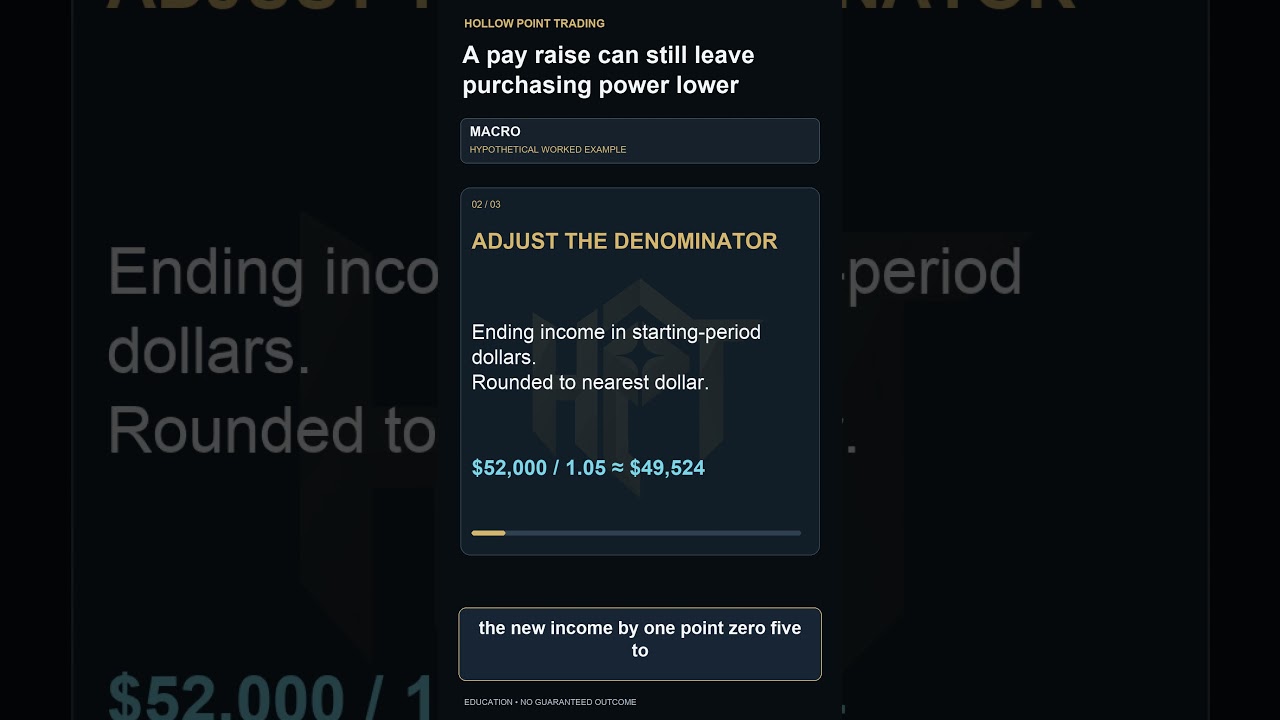
A pay raise measures dollars, not automatically purchasing power. In a hypothetical year, annual income rises from fifty thousand dollars to fifty two thousand. That is a four percent nominal increase. Suppose the relevant consumer price index rises five percent over the same period. Divide the new income by one point zero five to express it in ...

Why a Pay Raise May Not Boost Purchasing Power

Payroll Revisions: Read Beyond the Jobs Headline

https://youtu.be/fHQxne7pXV8

Read payroll revisions beside the new jobs headline #Shorts


The newest jobs headline is only one part of a payroll release. Imagine a report shows two hundred thousand jobs added in the latest month. Earlier estimates for the previous two months are revised down by forty thousand and thirty thousand. The combined backward revision is negative seventy thousand. Relative to the previously published employm...

Payroll Revisions: Read Beyond the Jobs Headline

How Currency Risk Can Erase Foreign Investment Gains

https://youtu.be/2vzS7fu-9m8

A foreign investment can rise locally and fall in dollars #Shorts


A foreign investment can gain in its home currency while losing value in dollars. Imagine an unhedged holding starts at one hundred euros, and each euro is worth one dollar. Its starting dollar value is one hundred dollars. The holding rises ten percent to one hundred ten euros. But suppose each euro is now worth ninety cents. Translate the endi...

How Currency Risk Can Erase Foreign Investment Gains

Apple Strong Close: Measure the Candle Before Naming It

https://youtu.be/fvf0aOzkZ_8

Apple strong close: measure it before naming it #Shorts


Apple closes at 335.17, near this candle high of 335.17. The real body is 0.35, within a total range of 0.46. That is approximately 76 percent body. This is a strong closing position, not necessarily a perfect marubozu with zero wicks. Use the actual measurements instead of forcing a pattern name. A strong candle can still fail; compare the next...

Apple Strong Close: Measure the Candle Before Naming It

NVIDIA Bullish Engulfing: Bodies vs. Wicks

https://youtu.be/ZXFEHufhhsM

NVIDIA bullish engulfing: bodies versus wicks #Shorts


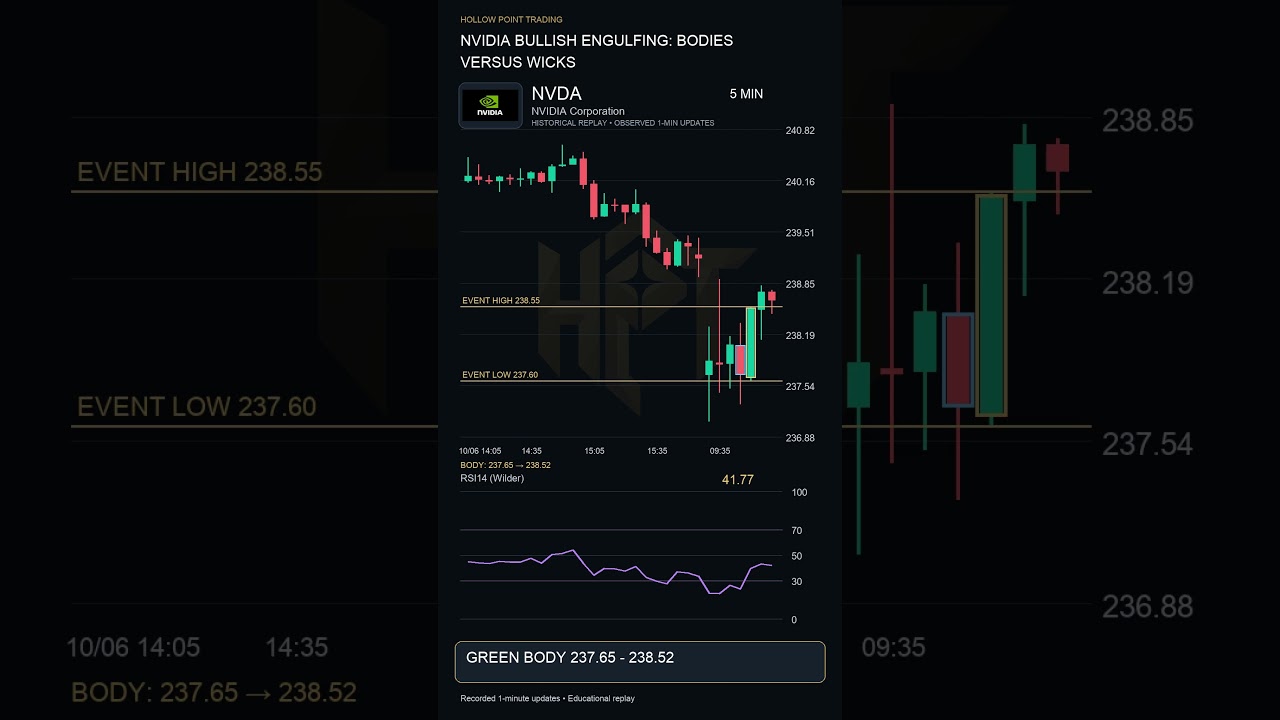
On NVIDIA, compare the two real bodies. The earlier red body spans 237.69 to 238.04. The next green candle opens at 237.65 and closes at 238.52, covering that body interval. This is bullish engulfing body geometry. It does not require taking out both prior wicks. Keep the definition separate from a trade: location, invalidation and the next comp...

NVIDIA Bullish Engulfing: Bodies vs. Wicks

Tesla Doji Explained: Why Small Bodies Still Move

https://youtu.be/ASE5EX75nP0

Tesla doji: small body does not mean no movement #Shorts


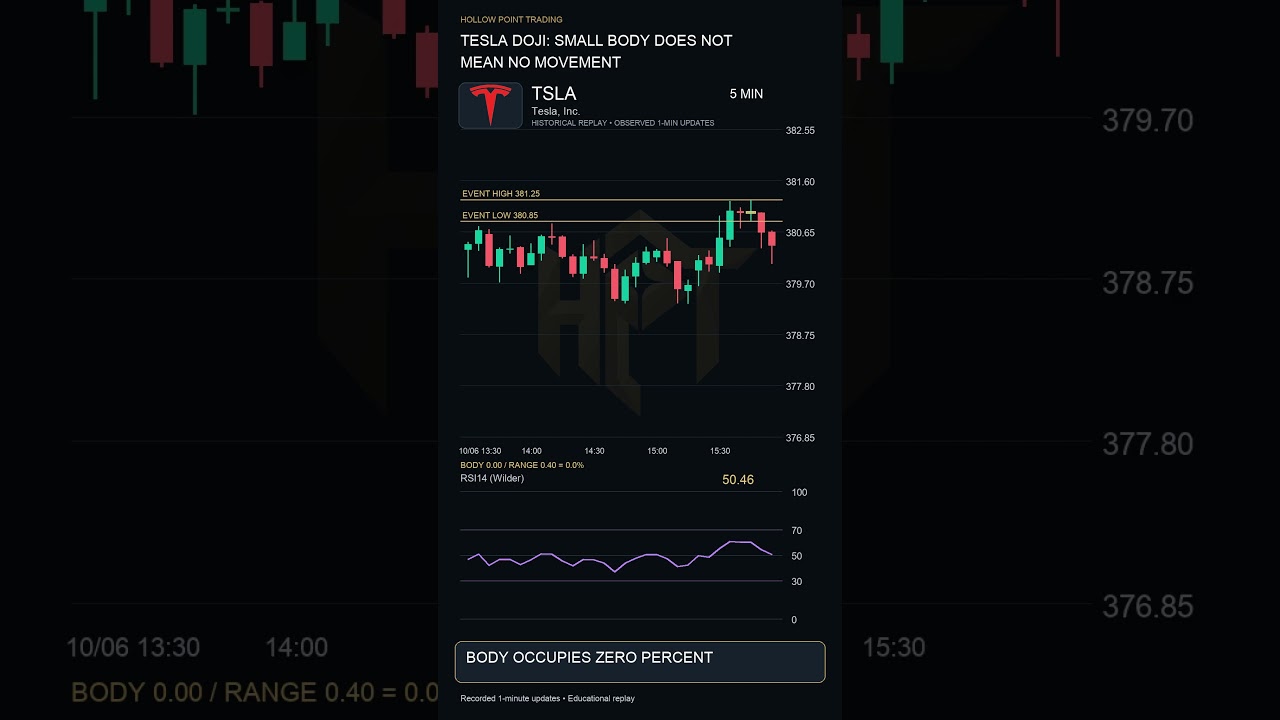
This Tesla candle has a real body of 0.00, but a full high to low range of 0.40. The body occupies approximately 0 percent of the range. Our explicit doji-like rule here is below eight percent. The open and close are close together, yet price still traveled inside the candle. A small body does not tell you the sequence of trades or promise a rev...

Tesla Doji Explained: Why Small Bodies Still Move

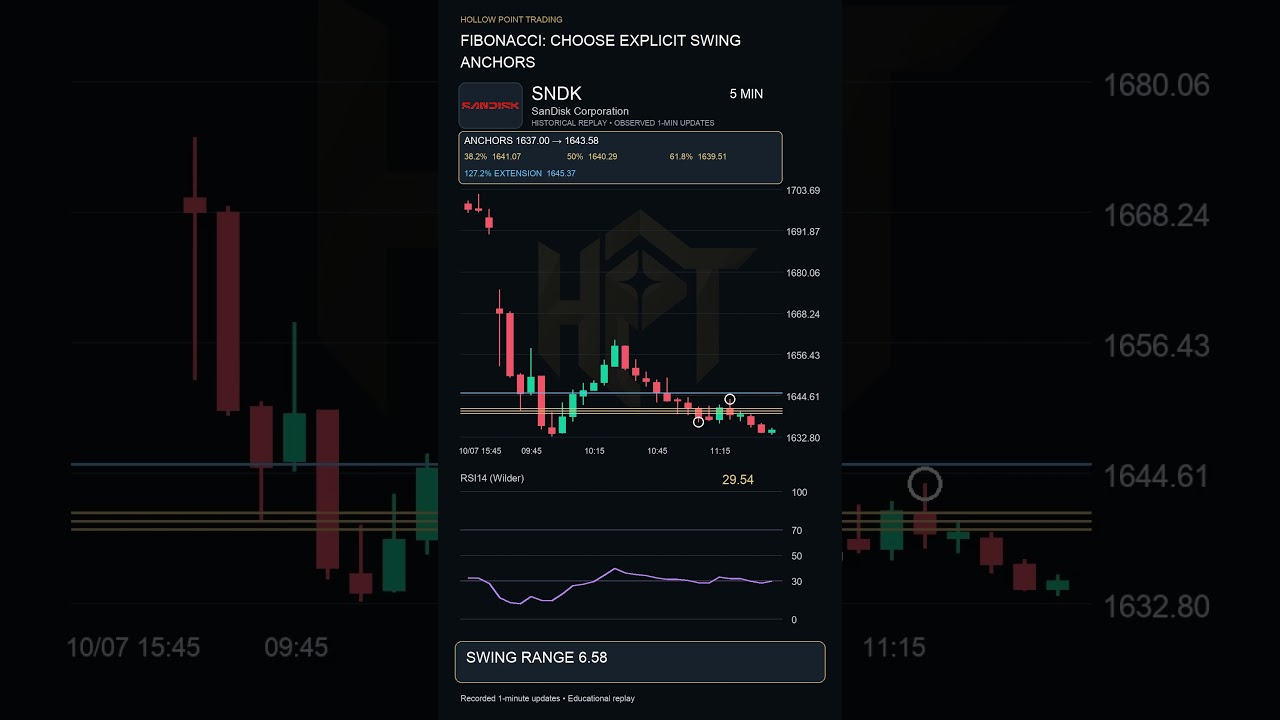
Fibonacci Retracement: Choose the Right Swing Anchors

https://youtu.be/rW9NFLWzfpc

Fibonacci: choose explicit swing anchors #Shorts #fibonacci


On Sandisk, this completed upswing starts at 1637.00 and ends at 1643.58. Those are the anchors, not random chart points. The range is 6.58. A thirty eight point two percent retracement subtracts that fraction of the range from the high, giving 1641.07. Different anchors create different levels. This is a historical worked example; the completed...

Fibonacci Retracement: Choose the Right Swing Anchors

NVDA Fibonacci Levels: 50% vs. 61.8% Retracement

https://youtu.be/j1HhuqrR1R4

NVDA Fibonacci: fifty versus sixty-one-eight #Shorts


Compare two retracement references on NVIDIA. This completed swing runs from 236.81 to 238.10. Halfway back from the high is 237.46. Sixty one point eight percent back is 237.30. Fifty percent is a common chart convention, not a Fibonacci ratio. Price can pass through both lines. Define the swing and watch the next completed candle rather than a...

NVDA Fibonacci Levels: 50% vs. 61.8% Retracement

Apple Fibonacci Extension: How the 1.272 Target Works

https://youtu.be/9HFMgMgV3UY

Apple Fibonacci extension: projection not promise #Shorts


This Apple extension uses a completed swing from 336.17 to 337.45. Multiply the swing range by one point two seven two, then add the original low. That projects 337.80, beyond the original high. Retracements sit inside the original swing; this extension sits above it. The arithmetic does not establish the probability of reaching the target. Keep...

Apple Fibonacci Extension: How the 1.272 Target Works

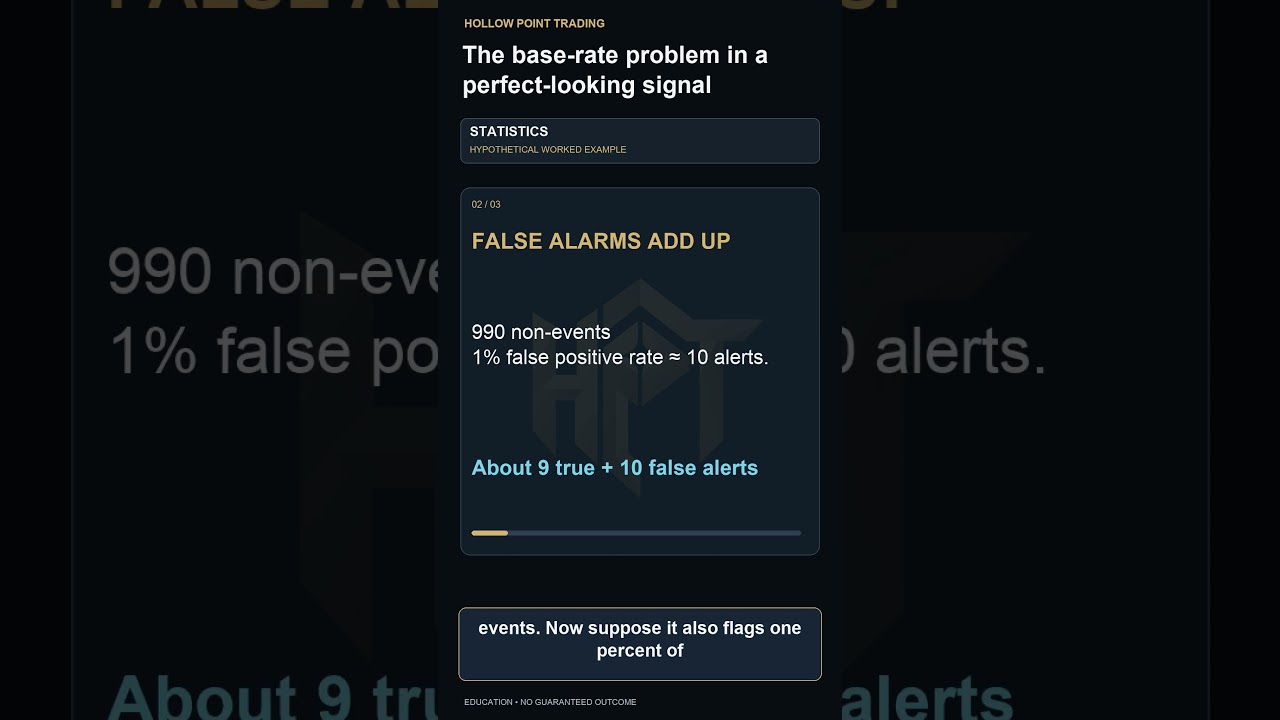
Why Accurate Trading Signals Can Still Mislead

https://youtu.be/3KC7OZcpShI

The base-rate problem in a perfect-looking signal #Shorts


A signal can look accurate and still produce many false alarms when the event is rare. Imagine one thousand cases, with a real event in only ten of them. A detector catches nine of those ten events. Now suppose it also flags one percent of the nine hundred ninety non-events, roughly ten false alarms. You receive about nineteen alerts, but only n...

Why Accurate Trading Signals Can Still Mislead

How Bond Discounts Increase Yield Without Changing Coupons

https://youtu.be/YkyGYrKIv9k

A bond discount changes yield without changing coupon #Shorts


A lower purchase price does not rewrite a fixed coupon. Imagine a bond with one thousand dollars of face value and a five percent annual coupon. It pays fifty dollars a year, assuming the issuer makes the promised payments. At a purchase price of one thousand dollars, that fifty dollars is a five percent current yield. At nine hundred dollars, t...

How Bond Discounts Increase Yield Without Changing Coupons

Option Delta Explained: Sensitivity, Not Probability

https://youtu.be/3aqtuBoJ_ms

Delta is sensitivity not a guaranteed probability #Shorts


Delta describes an estimated local price sensitivity. Suppose a call option has a delta of zero point four and the underlying rises by one dollar. Holding other inputs constant, the first order estimate is a forty cent rise in the quoted option premium per share. For a standard contract covering one hundred shares, that is approximately forty do...

Option Delta Explained: Sensitivity, Not Probability

Slower Growth Still Means Economic Expansion

https://youtu.be/ugY0ESJmWdI

A slowing growth rate can still mean expansion #Shorts


Slower growth does not automatically mean a shrinking economy. Consider a hypothetical output index that rises from one hundred to one hundred four, then to one hundred six. Output increased in both periods. The first growth rate is four percent. The second is two divided by one hundred four, about one point nine two percent. Growth slowed, but ...

Slower Growth Still Means Economic Expansion

Bullish Harami: Mark the Invalidation Level

https://youtu.be/Emp-P3SX0SI

Bullish harami: Mark the Invalidation Before the Next Candle #Shorts


Define the pattern low before interpreting this bullish harami. Look for a small real body contained inside a preceding large red real body, after a decline. Watch subsequent price cross that boundary. Invalidation is new evidence; a structural level does not guarantee a stop fill at its exact price.

Original Hollow Point Trading animation usin...

Bullish Harami: Mark the Invalidation Level

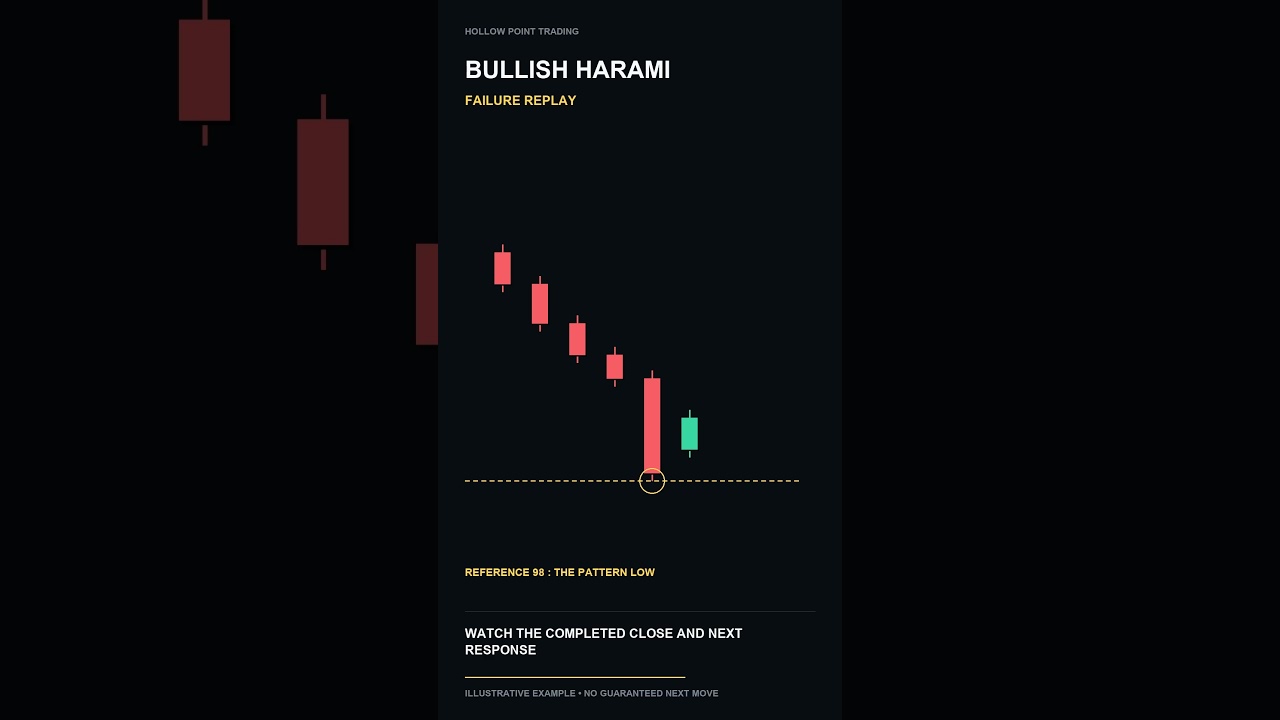
Bullish Harami Failure: Watch the Price Response

https://youtu.be/mc5-L9ExuwQ

Bullish harami Failed: Watch the Price Response #Shorts


Watch a bullish harami form after a decline, then fail. Its geometry is a small real body contained inside a preceding large red real body. Contrary follow-through crosses the pattern low, challenging the interpretation. A familiar pattern name does not guarantee the next move.

Original Hollow Point Trading animation using an illustrative price...

Bullish Harami Failure: Watch the Price Response

Bearish Engulfing Failure: Read the Price Response

https://youtu.be/rv9nZsyKq8g

Bearish engulfing Failed: Watch the Price Respo nse #Shorts


Watch a bearish engulfing form after rising prices, then fail. Its geometry is a red real body that encloses the preceding green real body. Contrary follow-through crosses the two-candle high, challenging the interpretation. A familiar pattern name does not guarantee the next move.

Original Hollow Point Trading animation using an illustrative p...

Bearish Engulfing Failure: Read the Price Response

Bearish Harami Failure: Watch the Price Response

https://youtu.be/u43vwJa4E68

Bearish harami Failed: Watch the Price Response #Shorts


Watch a bearish harami form after an advance, then fail. Its geometry is a small real body contained inside a preceding large green real body. Contrary follow-through crosses the pattern high, challenging the interpretation. A familiar pattern name does not guarantee the next move.

Original Hollow Point Trading animation using an illustrative p...

Bearish Harami Failure: Watch the Price Response