Hollow Point Trading
Hollow Point Trading Discord server banner

Hollow Point Trading Updates & Events

Server Updates & Events

Announcements

Why Annual Inflation Falls While Prices Keep Rising

https://youtu.be/m-nB7fjaFQQ

Annual inflation can fall while prices rise this month #Inflation #...


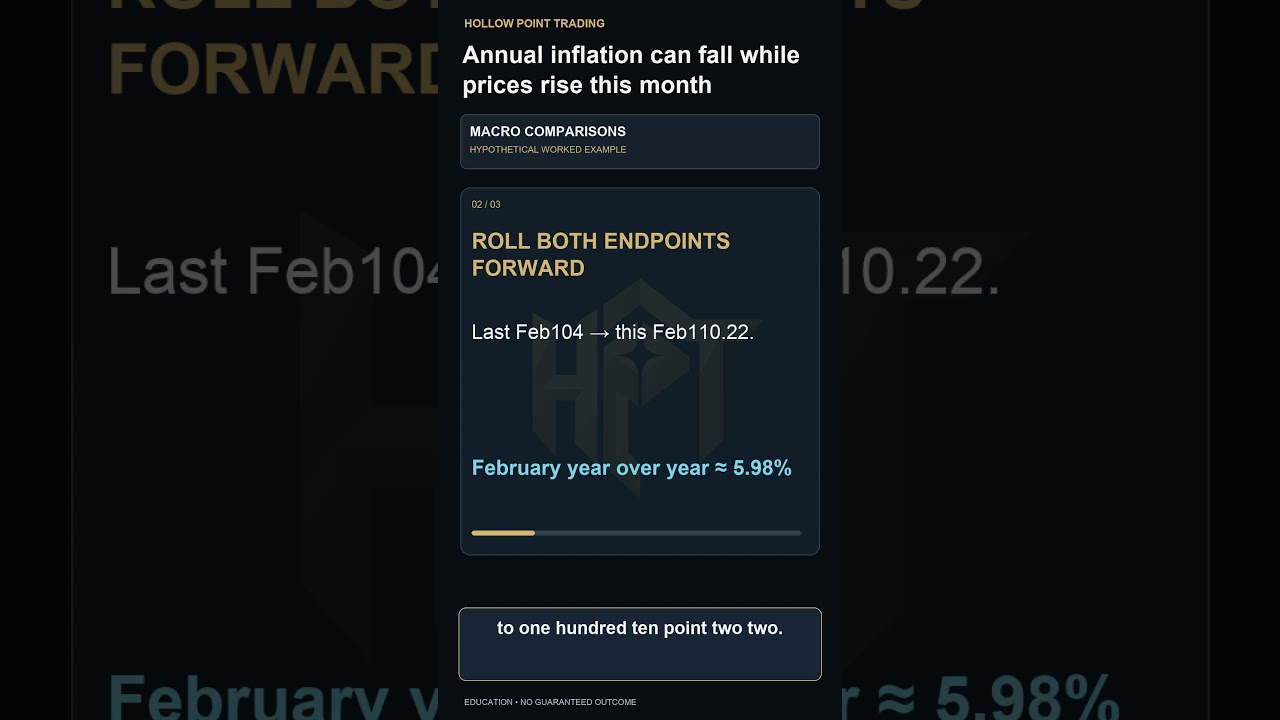
An annual inflation rate can fall even while the latest monthly price index rises. Consider a hypothetical index using one consistent reference base. Last January it was one hundred. Last February it jumped to one hundred four. This January it reaches one hundred ten, a ten percent annual increase. This February it rises another zero point two p...
Why Annual Inflation Falls While Prices Keep Rising

CRM Volatility: Two Ways to Calculate Standard Deviation

https://youtu.be/qsE8cA0FPLM

CRM: the same five closes can have two standard deviations #CRM #St...


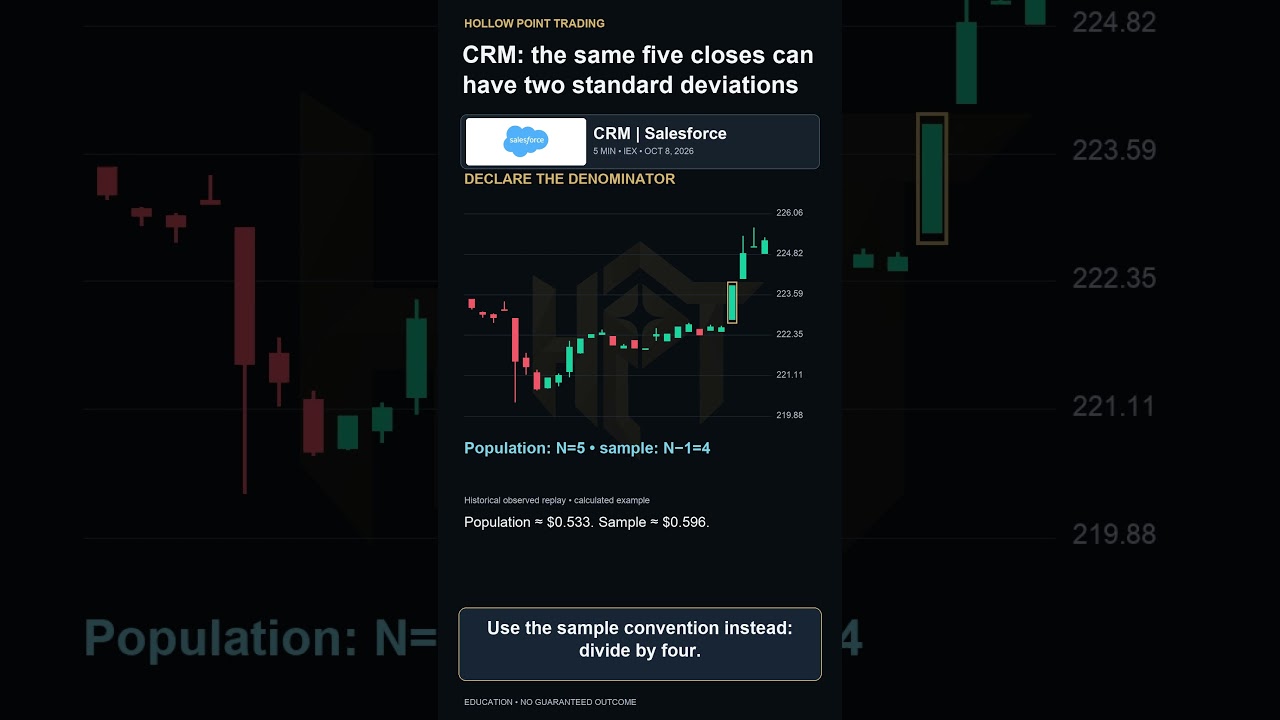
Two different standard deviations can describe the exact same five prices. This historical Salesforce IEX replay uses five completed five minute closes from October eighth, twenty twenty six. Treat those five observations as the entire set being described. Divide the sum of squared distances from their mean by five, then take the square root. Po...

CRM Volatility: Two Ways to Calculate Standard Deviation

How Stock Splits Change an Index Divisor

https://youtu.be/DGTpd4mKnRk

Why an index divisor changes after a stock split #StockSplit #Index...


A stock split should not create a fake market loss in a price weighted index. Consider a hypothetical two stock index. The prices are one hundred dollars and fifty dollars. With a divisor of two, the index level is seventy five. The first stock has a two for one split, cutting its price to fifty dollars with no economic price move. The new price...

How Stock Splits Change an Index Divisor

How a Small Stock Position Can Boost Portfolio Returns

https://youtu.be/FRzEcE2hED4

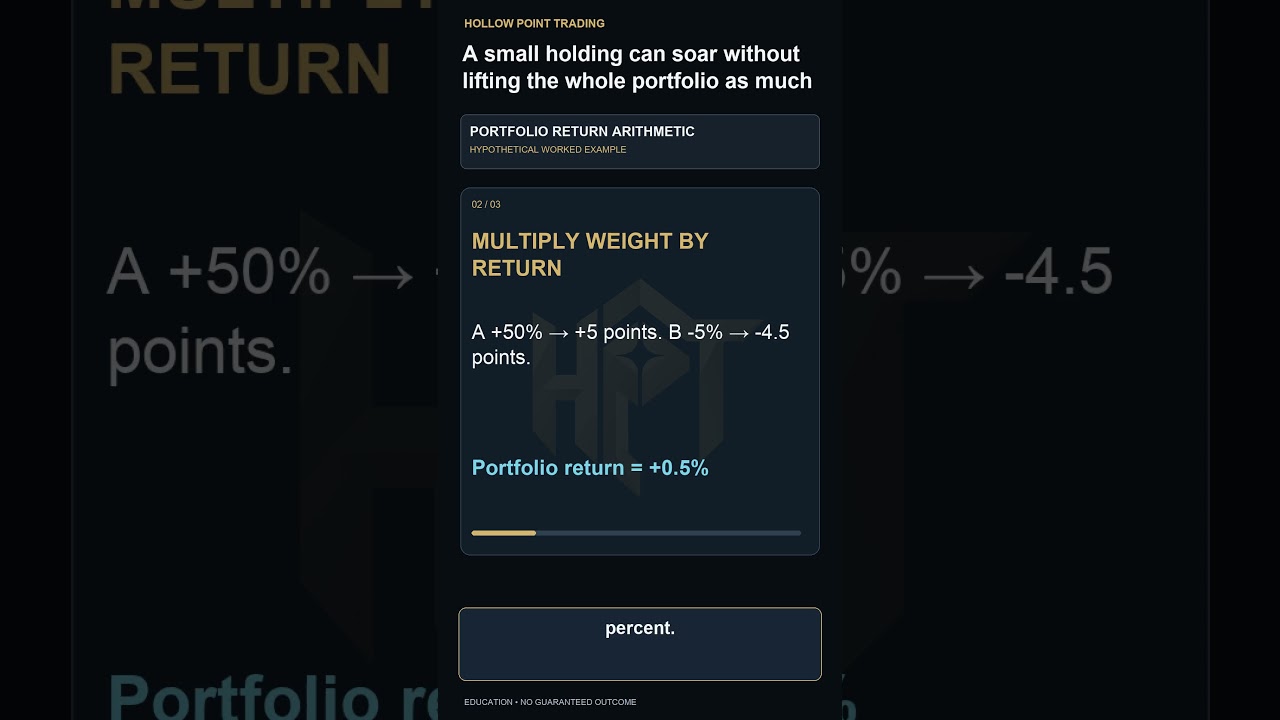
A small holding can soar without lifting the whole portfolio as muc...


A stock return and its portfolio contribution are different numbers. Consider a hypothetical portfolio with ten percent in asset A and ninety percent in asset B at the start of one period. There are no cash flows, fees or rebalancing. Asset A gains fifty percent while B loses five percent. A contributes five percentage points to the portfolio re...

How a Small Stock Position Can Boost Portfolio Returns

AMZN Price Path: Long Journey, Near-Flat Finish

https://youtu.be/fkwoXYReWl4

AMZN: a long price path can end near its start #AMZN #EfficiencyRat...


Price can travel a long way and end near its start. This historical Amazon IEX replay uses eleven completed five minute closes from October eighth, twenty twenty six, giving ten close to close intervals. The first close is two fifty eight point zero seven. The last is two fifty eight point three six. Absolute net displacement is twenty nine cent...

AMZN Price Path: Long Journey, Near-Flat Finish

Option Vega Explained: Volatility Points vs. Percent Changes

https://youtu.be/zAqbPp-U8y8

Vega: a volatility percentage point is not a one-percent relative c...


A volatility percentage point is different from a one percent relative change. In a hypothetical option, implied volatility moves from twenty percent to twenty one percent. That is one percentage point, but a five percent relative increase in the volatility number. Suppose quoted vega is ten cents per share for each volatility percentage point. ...

Option Vega Explained: Volatility Points vs. Percent Changes

Elder Ray Explained: Bear Power Isn’t Seller Count

https://youtu.be/hdkQAMm92HE

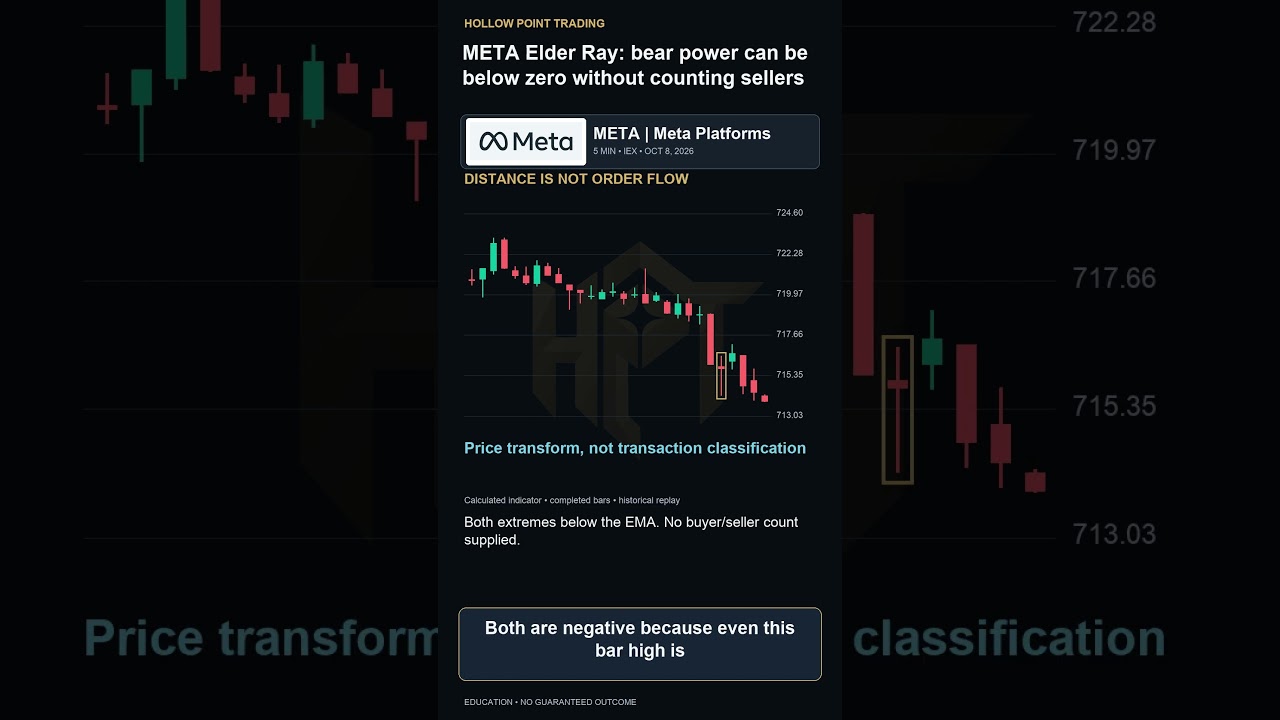
META Elder Ray: bear power can be below zero without counting selle...


Bear Power is a price distance, not a count of sellers. This historical Meta IEX replay uses completed five minute bars from October eighth, twenty twenty six. We declare a thirteen period close EMA seeded at the first available close. At the highlighted bar, the EMA is approximately seven eighteen point six seven dollars. The high is seven sixt...

Elder Ray Explained: Bear Power Isn’t Seller Count

How Rising Assets Shift Portfolio Weights

https://youtu.be/byNqtX9uJro

A winning asset changes its portfolio weight without a new purchase...


An asset can become a larger portfolio weight without buying another share. Start with a hypothetical ten thousand dollar portfolio: six thousand in asset A and four thousand in asset B. The starting weights are sixty and forty percent. Suppose A rises twenty percent while B stays unchanged, with no deposits or withdrawals. A becomes seventy two...

How Rising Assets Shift Portfolio Weights

UNH Candlestick Lesson: Green but Below Prior Close

https://youtu.be/Y_moXy8H5LA

UNH: a green candle can still close below the prior close #UNH #Can...


A green candle can still finish below the previous close. This historical UnitedHealth IEX replay uses five minute intervals from October eighth, twenty twenty six. We color standard candles by their own open and close, not by comparison with the preceding close. The prior close is three seventy two point five seven five dollars. The highlighted...

UNH Candlestick Lesson: Green but Below Prior Close

Costco DPO Explained: Centered Plots and Timing

https://youtu.be/G_1lMpSVXlc

COST DPO: a centered plot does not move information back in time #C...


A centered indicator plot does not move information back in time. This historical Costco IEX replay uses completed five minute bars from October eighth, twenty twenty six. For a twenty period Detrended Price Oscillator, the declared formula subtracts the current twenty close simple average from the close eleven bars earlier. The earlier close is...

Costco DPO Explained: Centered Plots and Timing

GOOGL Stoch RSI: How a Maximum Reading Works

https://youtu.be/lvl7zgHWKL8

GOOGL Stoch RSI: a maximum reading can coexist with RSI below fifty...


A maximum Stochastic RSI reading does not require RSI itself to be above fifty. This historical Alphabet IEX replay uses completed five minute closes from October eighth, twenty twenty six. We seed fourteen period Wilder RSI with fourteen price changes, then update recursively. At the highlighted close, RSI is approximately forty point one two. ...

GOOGL Stoch RSI: How a Maximum Reading Works

MSFT Bollinger BandWidth: Dollars vs. Percent

https://youtu.be/5EmRM8K1xpE

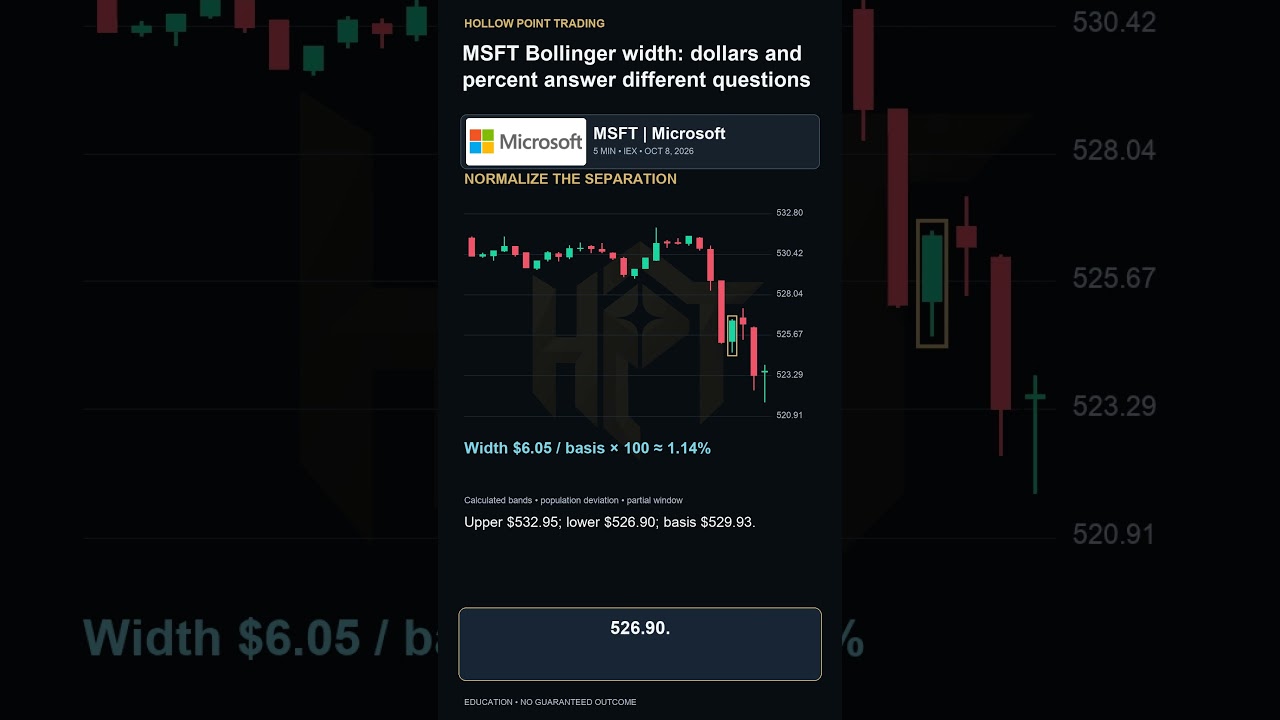
MSFT Bollinger width: dollars and percent answer different question...


Bollinger BandWidth is not the same as a stock return. This historical Microsoft IEX replay uses twenty completed five minute closes from October eighth, twenty twenty six. We declare a simple average and population standard deviation, with bands two deviations away. The middle band is approximately 529.93 dollars. The upper band is 532.95, and ...

MSFT Bollinger BandWidth: Dollars vs. Percent

DE Fibonacci: Linear vs. Logarithmic Midpoints

https://youtu.be/-0Frl29DCtU

DE Fibonacci: the price scale changes the midpoint #DE #Fibonacci #...


The same two Fibonacci anchors can produce different midpoint prices when the calculation scale changes. This historical Deere IEX replay uses completed five minute bars from October eighth, twenty twenty six. The declared observed anchors are six thirty eight point three nine and six fifty six point seven zero. For a linear fifty percent level,...

DE Fibonacci: Linear vs. Logarithmic Midpoints

How Dividends Affect Early Call Exercise

https://youtu.be/ymomEWj_MhI

A dividend can change early exercise incentives #Dividends #EarlyEx...


An upcoming dividend can change a call holder's early exercise incentives. Imagine an American style call with a ninety five dollar strike. The stock is one hundred dollars and the call premium is five dollars twenty cents per share. Intrinsic value is five dollars. The remaining twenty cents is extrinsic value. Suppose an upcoming cash dividend...

How Dividends Affect Early Call Exercise

Bid-Ask Midpoint: Why It’s Not a Guaranteed Fill

https://youtu.be/qoiDIL8jc28

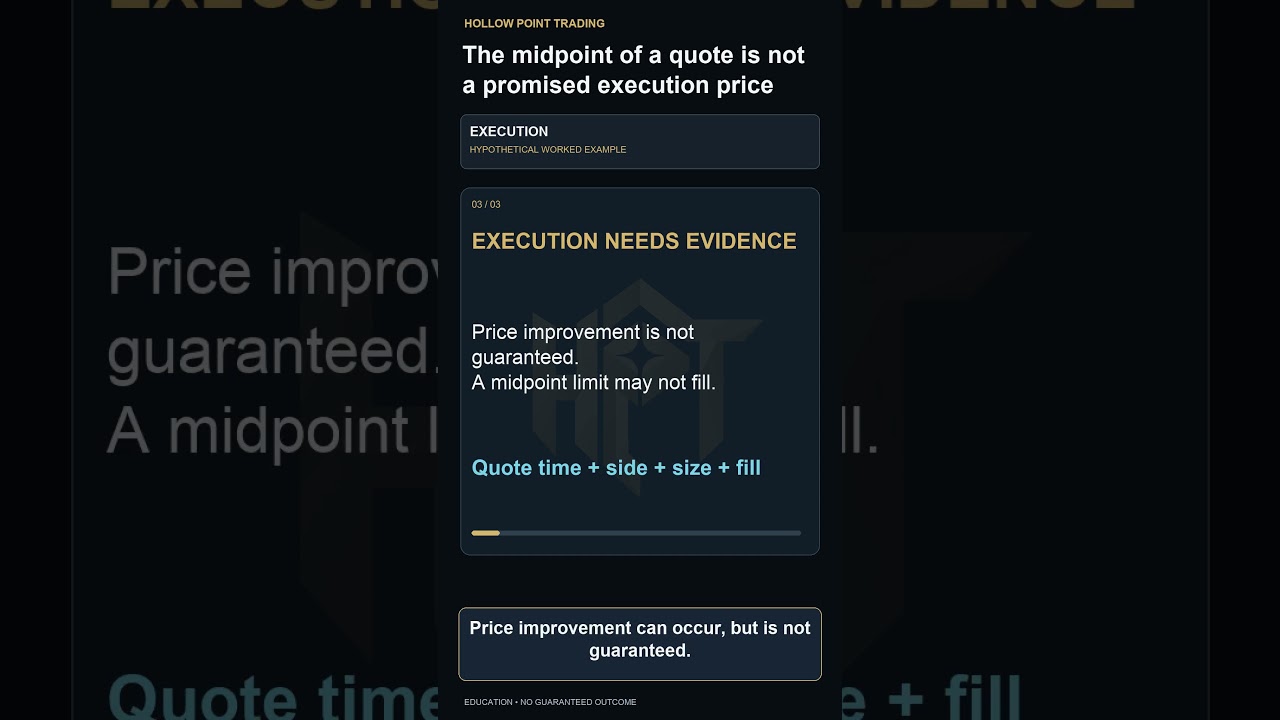
The midpoint of a quote is not a promised execution price #BidAskSp...


A quote midpoint is a calculation, not a promised fill. In a hypothetical stock quote, the bid is fifty dollars and the ask is fifty dollars twenty cents. Their midpoint is fifty dollars ten cents. For one hundred shares, that midpoint reference is five thousand ten dollars. Buying those shares at the stated ask instead would cost five thousand ...

Bid-Ask Midpoint: Why It’s Not a Guaranteed Fill

Annual Subscriptions: Cash Received vs. Revenue Earned

https://youtu.be/dPrcOi5Xj8o

An annual subscription payment is not all revenue today #RevenueRec...


Cash received today is not always revenue earned today. Imagine a hypothetical business collects twelve hundred dollars before a twelve month service begins. Assume one stand ready service obligation is satisfied evenly over those months, with no other contract features. Initially, cash rises twelve hundred dollars and the contract liability ris...

Annual Subscriptions: Cash Received vs. Revenue Earned

AVGO EMA Explained: Why 20 Periods Isn’t a Cutoff

https://youtu.be/-E1OiwxqYx0

AVGO EMA: twenty periods is not a twenty-bar cutoff #AVGO #EMA #Mov...


A twenty period exponential average does not forget a price exactly twenty bars later. This historical Broadcom IEX replay shows completed five minute bars from October eighth, twenty twenty six. For the conventional twenty period EMA, the new close receives a weight of two divided by twenty one. That is approximately nine point five two percent...

AVGO EMA Explained: Why 20 Periods Isn’t a Cutoff

BAC Force Index: How Price Change Drives the Signal

https://youtu.be/VwZjFolBQoE

BAC Force Index: multiply price change, not the price level #BAC #F...


Force Index starts with a change in closing price, not the entire stock price. This historical Bank of America IEX replay uses completed five minute bars from October eighth, twenty twenty six. The prior close is fifty two point six five five. The next close is fifty two point seven zero five. The change is five cents. Multiply zero point zero f...

BAC Force Index: How Price Change Drives the Signal

UNH Stochastic Signal Line Explained with 5-Minute Data

https://youtu.be/DDeFQpPcbEU

UNH stochastic: the signal line averages earlier readings #UNH #Sto...


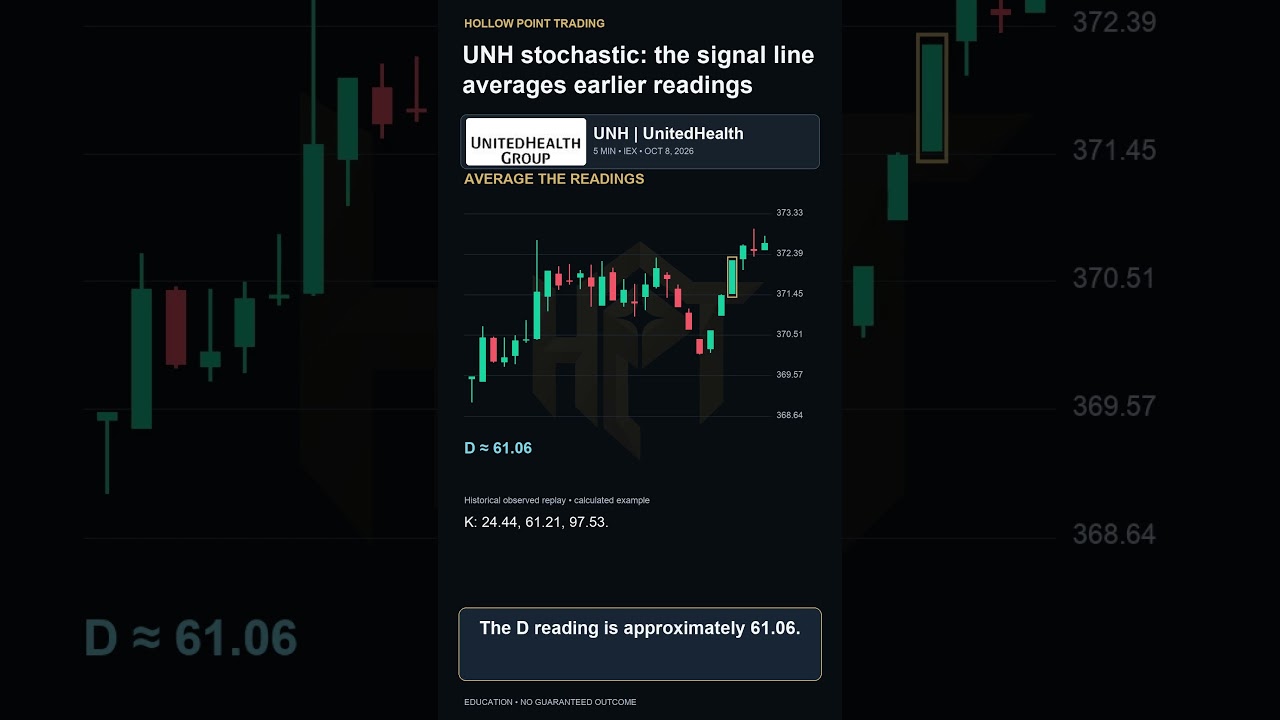
The stochastic signal line does not describe only the latest candle. This historical UnitedHealth IEX replay uses completed five minute bars from October eighth, twenty twenty six. We explicitly use unsmoothed fourteen bar percent K, then a three reading simple average for percent D. The three latest K readings are approximately 24.44, 61.21, an...

UNH Stochastic Signal Line Explained with 5-Minute Data

CRM OBV: How Volume Tracks Price Direction

https://youtu.be/Vff-1u8Jh_4

CRM OBV: a small rise and a large rise use the same volume rule #CR...


On balance volume does not multiply volume by the size of a price change. This historical Salesforce IEX replay uses completed five minute bars from October eighth, twenty twenty six. The prior close is two twenty two point five nine. The next close is two twenty three point eight six. The close rose by one dollar twenty seven cents. Recorded vo...

CRM OBV: How Volume Tracks Price Direction

Core Inflation vs. Your Grocery Budget Explained

https://youtu.be/TfOGWwa20P4

Core inflation is not your personal grocery budget #Inflation #Core...


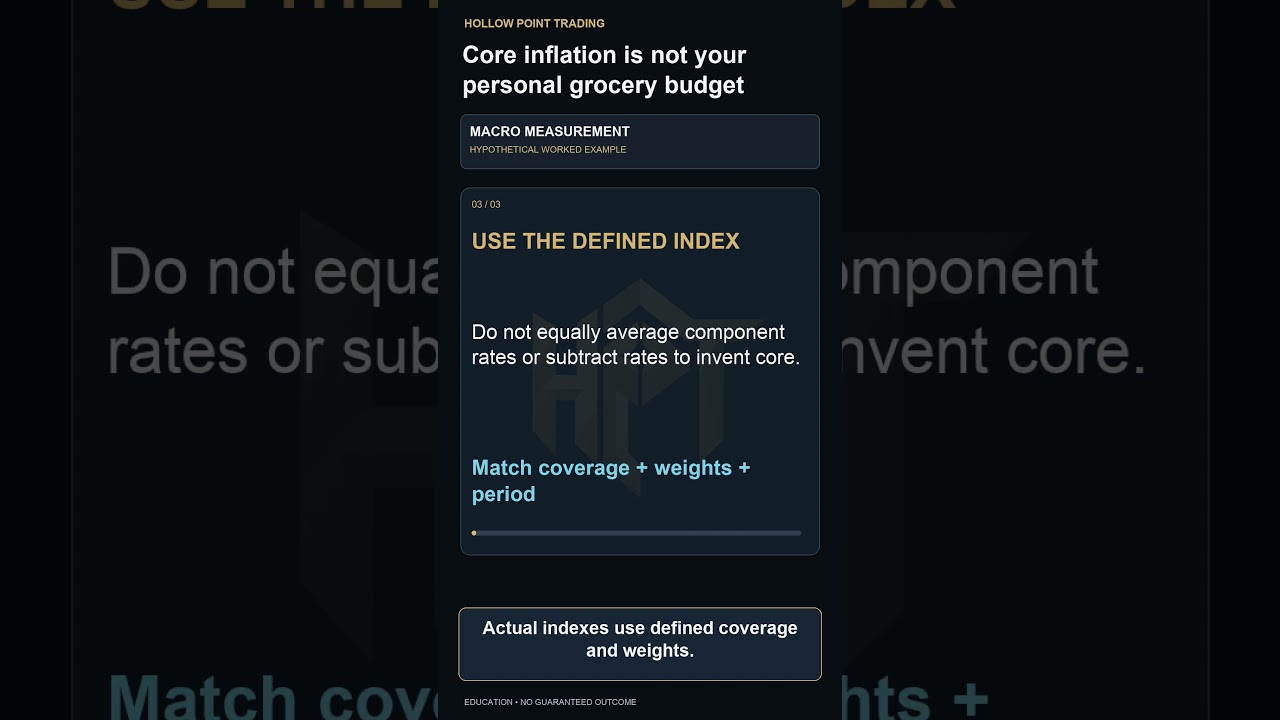
Core inflation does not mean food stopped costing money. The common core consumer price measure excludes food and energy. Headline inflation includes those categories. The exclusion changes the measurement; it does not erase household expenses. Consider two explicitly hypothetical spending baskets. One household spends forty dollars of every hun...

Core Inflation vs. Your Grocery Budget Explained

How Currency Risk Can Turn Gains Into Dollar Losses

https://youtu.be/dZa9P3xMpwM

A foreign market gain can become a dollar loss #CurrencyRisk #Forex...


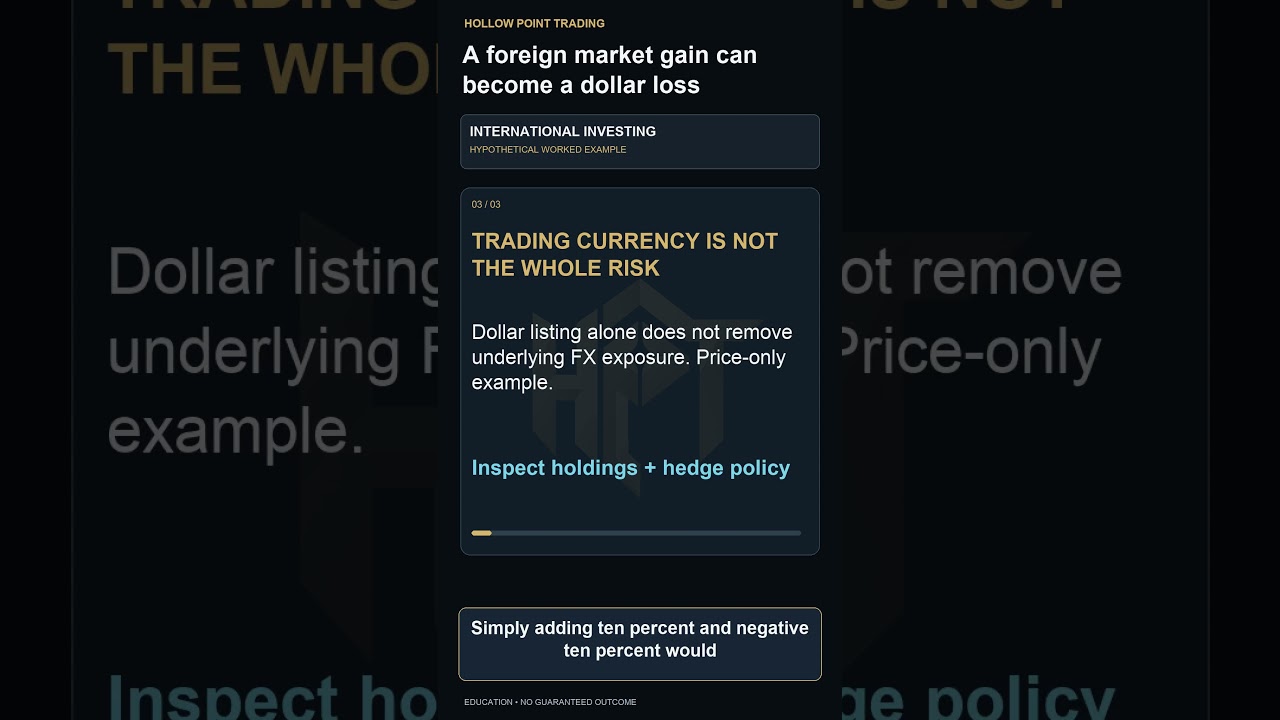
A foreign investment can rise locally while losing dollars. In this hypothetical unhedged example, a holding worth one hundred euros rises ten percent to one hundred ten euros. Initially, one euro buys one dollar. Now suppose one euro buys ninety cents. The holding converts to ninety nine dollars, versus the original one hundred dollars. The dol...

How Currency Risk Can Turn Gains Into Dollar Losses

UNH Candlestick Wicks: What a Wickless Bar Really Means

https://youtu.be/XVYzTOjfTnA

UNH candles: no wick does not prove a one-way path #UNH #Candlestic...


A candle without visible wicks does not prove price moved only one way. This historical UnitedHealth IEX five minute bar opened at three seventy one point four seven and closed at three seventy two point two five. The recorded low equals the open, and the high equals the close. Its body and full range both measure seventy eight cents. Those four...

UNH Candlestick Wicks: What a Wickless Bar Really Means

CRM HL2: Why the Range Midpoint Isn’t the Median

https://youtu.be/cgf0bU-vb-8

CRM HL2: the range midpoint is not a transaction median #CRM #HL2 #...


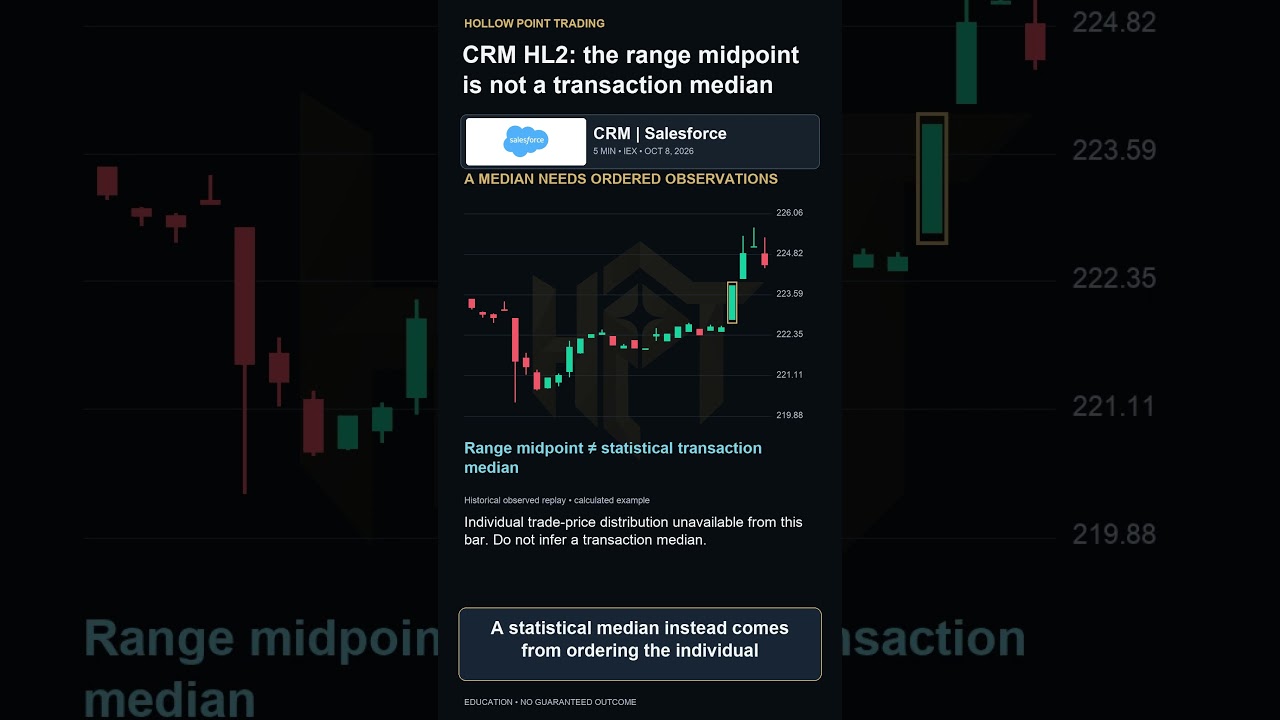
A high low midpoint is not automatically the median transaction price. This historical Salesforce IEX example uses a completed five minute bar from October eighth, twenty twenty six. Its high is two twenty three point eight six; its low is two twenty two point eight two. Add those extremes to get four forty six point six eight, then divide by tw...

CRM HL2: Why the Range Midpoint Isn’t the Median

AVGO Realized Volatility: A Better Calculation

https://youtu.be/xld0hKlHILU

AVGO realized volatility: square returns before adding #AVGO #Reali...


Adding signed returns can hide movement that cancels. This historical Broadcom IEX example uses five completed five minute closes from October eighth, twenty twenty six. Five closes provide four consecutive log returns. Each is the natural logarithm of the next close divided by the previous close. For this declared twenty minute window, square e...

AVGO Realized Volatility: A Better Calculation